90
80 H
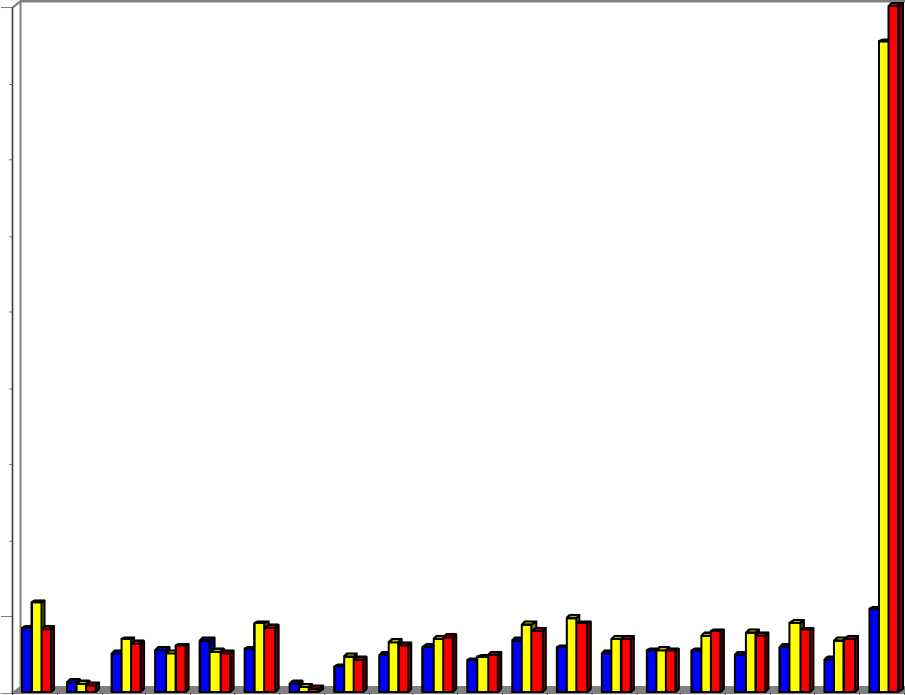
Figure 5: Netherlands:: Jobs Created Economy Wide (in the VIS) by F1. Lm. 1997
70
60
50
40
30
20
10
□ 1997
□ 1986
□ 1977
AGRI
CULT
URE,
8.3
11.7
8.2
MINI
NG
AND
1.2
1.1
0.8
FOOD
PROD
UCTS
5
6.8
6.3
TEXTI
LES,
TEXTI
5.5
5.1
6
WOO
D
AND
6.7
5.3
5.1
PULP,
PAPE
R,
5.6
8.9
8.4
COKE
REFI
1
0.6
0.4
CHE
MICA
LS
3.3
4.6
4.2
RUB
BER
AND
4.9
6.5
6.1
OTHE
R
NON-
5.9
6.9
7.1
IRON
&
STEE
4.1
4.5
4.8
FABR
ICAT
ED
6.7
8.8
8
MAC
HINE
RY
5.8
9.7
8.9
OFFI
CE,
ACC
5
6.9
6.9
RADI
O,
TELE
5.4
5.5
5.4
MEDI
CAL,
PREC
5.4
7.4
7.9
MOT
OR
VEHI
4.9
7.8
7.4
BUIL
DING
AND
5.9
9
8.1
OTHE
R
TRAN
4.2
6.7
7
MAN
UFAC
TURI
10.8
85.3
90
Ollllllllililllli
ELEC
TRICI
TY,
2.6
2.5
2.5
CONS
TRUC
TION
8.2
9
9.4
WHOL
ESAL
E
7.3
11.9
10.4
HOTE
LS
AND
9
10.9
10.4
TRAN
SPOR
T
7.9
9.6
7.7
POST
AND
TELE
5.2
9.1
9
FINA
NCE,
INSU
5.7
6.9
8
REAL
ESTA
TE
6.7
8.6
7.8
COM
MUNI
TY,
10.1
15.3
10.3
57
More intriguing information
1. Analyse des verbraucherorientierten Qualitätsurteils mittels assoziativer Verfahren am Beispiel von Schweinefleisch und Kartoffeln2. THE CHANGING RELATIONSHIP BETWEEN FEDERAL, STATE AND LOCAL GOVERNMENTS
3. Foreword: Special Issue on Invasive Species
4. NATURAL RESOURCE SUPPLY CONSTRAINTS AND REGIONAL ECONOMIC ANALYSIS: A COMPUTABLE GENERAL EQUILIBRIUM APPROACH
5. Confusion and Reinforcement Learning in Experimental Public Goods Games
6. Perceived Market Risks and Strategic Risk Management of Food Manufactures: Empirical Results from the German Brewing Industry
7. Revisiting The Bell Curve Debate Regarding the Effects of Cognitive Ability on Wages
8. Towards a Strategy for Improving Agricultural Inputs Markets in Africa
9. The name is absent
10. The name is absent