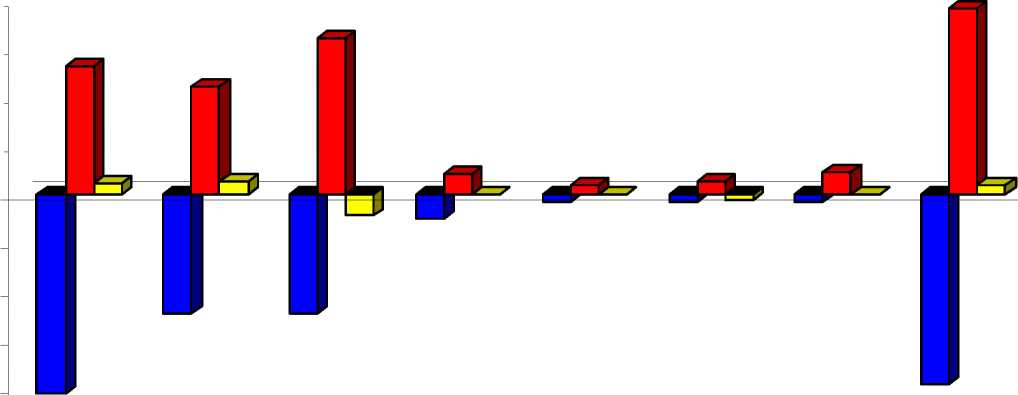
Figure 22: Decomposition of Employment Change in the VIS from Consumption among
Demand, Labour Productivity and Structural Change, Spain 1995 - 1980
4000
3000
2000
1000
-1000
-2000
-3000
-4000
-5000
|
TOTAL MANUFACTURING |
WHOLESALE AND |
HOTELS AND RESTAURANTS |
TRANSPORTAND |
POSTAND IONS |
FINANCE, |
REAL ESTATE, |
COMMUNITY, | |
|
■ PROD |
-4114.3682 |
-2462.7784 |
-2466.0935 |
-499.0795 |
-165.4822 |
-154.57 |
-168.0485 |
-3942.0045 |
|
□ DEM |
2661.2673 |
2226.1562 |
3258.3708 |
440.8377 |
178.3757 |
275.3821 |
448.5678 |
3858.998 |
|
□ INT_IND_INTD |
229.4084 |
285.2525 |
-443.7738 |
10.7858 |
15.1413 |
-118.4322 |
18.1753 |
179.6515 |
76
More intriguing information
1. Innovation Policy and the Economy, Volume 112. Ronald Patterson, Violinist; Brooks Smith, Pianist
3. Elicited bid functions in (a)symmetric first-price auctions
4. The name is absent
5. Investment in Next Generation Networks and the Role of Regulation: A Real Option Approach
6. CREDIT SCORING, LOAN PRICING, AND FARM BUSINESS PERFORMANCE
7. The name is absent
8. Regulation of the Electricity Industry in Bolivia: Its Impact on Access to the Poor, Prices and Quality
9. The name is absent
10. Stable Distributions