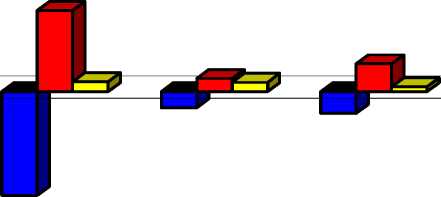
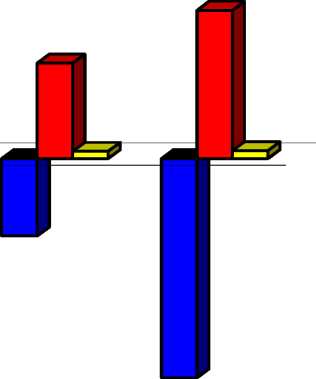
Figure 20: Decomposition of Employment Change in the VIS due Consumption among
Demand, Labour Productivity and Structural Change, France 1995 - 1977
3000
2000
1000
0
-1000
-2000
-3000


|
-4000 | ||||||||
|
TOTAL |
WHOLESALE AND |
HOTELS AND |
TRANSPORT AND |
POST AND TELECOMMUNICATION |
FINANCE, INSURANCE, |
COMMUNITY, SOCIAL | ||
|
■ PROD |
-3426,7623 |
-1672,8333 |
-261,7144 |
-351,2882 |
-321,5696 |
-1251,221 |
-3536,5813 | |
|
■ DEM |
2520,63 |
1306,5662 |
209,0013 |
447,1149 |
339,7508 |
1536,5745 |
2391,0831 | |
|
Dintjndjntd |
-492,6689 |
159,2042 |
148,512 |
77,8906 |
6,0845 |
115,4659 |
125,018 | |
Total Manufacturing comprises: Agiculture (ISIC 1), Mining and Quarrying (ISIC 2), Manufacturing (ISIC 3), Public Utilities (ISIC 4), Construction (ISIC
5)
PRD: Productivity Growth Effect (Darj Shade, negative), DEN: Demand Growth Effect (Dark Shade, positive), INT_IND: Industry Linkages (pale
shade).
73
More intriguing information
1. The Works of the Right Honourable Edmund Burke2. AGRICULTURAL TRADE IN THE URUGUAY ROUND: INTO FINAL BATTLE
3. Moi individuel et moi cosmique Dans la pensee de Romain Rolland
4. The name is absent
5. The mental map of Dutch entrepreneurs. Changes in the subjective rating of locations in the Netherlands, 1983-1993-2003
6. Quelles politiques de développement durable au Mali et à Madagascar ?
7. Economic Evaluation of Positron Emission Tomography (PET) in Non Small Cell Lung Cancer (NSCLC), CHERE Working Paper 2007/6
8. The Determinants of Individual Trade Policy Preferences: International Survey Evidence
9. IMPACTS OF EPA DAIRY WASTE REGULATIONS ON FARM PROFITABILITY
10. Momentum in Australian Stock Returns: An Update