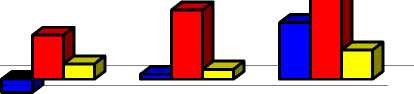
Figure 17: Decomposition of Employment Change in the VIS due to Consumption among
Demand, Labour Productivity and Structural Change, US 1997 - 1977
15000
10000
5000
0
-5000


|
-10000 | |||||||||
|
TOTAL MANUFACTURING |
WHOLESALE AND RETAIL TRADE; REPAIRS |
HOTELS AND |
TRANSPORT AND |
POST AND TELECOMMUNICATIONS |
FINANCE, INSURANCE |
REAL ESTATE AND |
COMMUNITY, SOCIAL | ||
|
■ PROD |
-5757,0221 |
-7762,121 |
-196,7122 |
-581,1857 |
-1139,2818 |
-654,6372 |
250,7685 |
2830,3703 |
|
■ DEM |
3757,7444 |
13976,9023 |
352,3712 |
1145,3835 |
1346,3912 |
2200,3631 |
3464,6241 |
11512,4576 |
|
Ointjndjntd |
174,9856 |
151,9181 |
754,0122 |
-18,5075 |
335,6699 |
766,3657 |
503,5227 |
1459,8042 |
Total Manufacturing comprises: Agiculture (ISIC 1), Mining and Quarrying (ISIC 2), Manufacturing (ISIC 3), Public Utilities (ISIC 4), Construction (ISIC
5)
PRD: Productivity Growth Effect (Darj Shade, negative), DEN: Demand Growth Effect (Dark Shade, positive), INT_IND: Industry Linkages (pale
shade).
70
More intriguing information
1. CREDIT SCORING, LOAN PRICING, AND FARM BUSINESS PERFORMANCE2. Linking Indigenous Social Capital to a Global Economy
3. ALTERNATIVE TRADE POLICIES
4. The Shepherd Sinfonia
5. GOVERNANÇA E MECANISMOS DE CONTROLE SOCIAL EM REDES ORGANIZACIONAIS
6. The name is absent
7. Housing Market in Malaga: An Application of the Hedonic Methodology
8. Towards Teaching a Robot to Count Objects
9. The name is absent
10. The name is absent