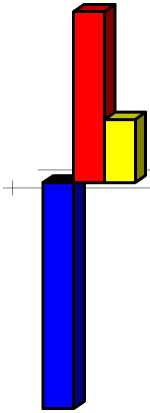
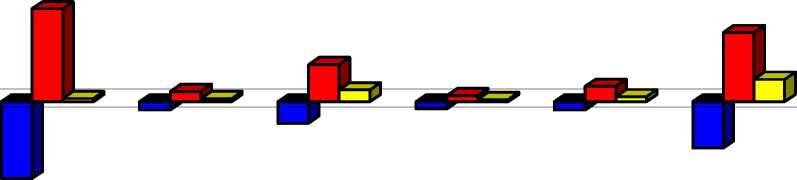
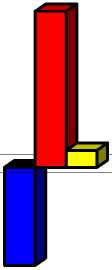
Figure 15: Decomposition of Employment Change in the VIS among Final Demand, Labour
Productivity and Structural Change, The Netherlands 1997 - 1986
100
50
0
-50
-100
|
-150 |
TOTAL MANUFACTURING |
WHOLESALE AND RETAIL TRADE; REPAIRS |
HOTELS AND |
TRANSPORT AND |
POST AND |
FINANCE, |
REAL ESTATE AND BUSINESS SERVICES |
COMMUNITY, |
|
■ PROD |
-126,2132 |
-42,91795 |
-4,62143 |
-11,99892 |
-4,03806 |
-4,68199 |
-25,88771 |
-54,72636 |
|
ODEM |
95,46885 |
51,76476 |
5,67431 |
20,63515 |
3,32947 |
8,55422 |
38,59506 |
87,22204 |
|
Dintjndjntd |
35,25441 |
1,81165 |
1,66813 |
6,55775 |
1,16608 |
2,70883 |
12,4488 |
9,59001 |
Total Manufacturing comprises: Agriculture (ISIC 1), Mining and Quarrying (ISIC 2), Manufacturing (ISIC3), Public Utilities (ISIC 4), and Construction
(ISIC 5).
PRD: Productivity Growth Effect (Dark Shade, negative), DEM: Demand Growth Effect (Dark Shade, positive), INT_IND_INTD : Effects of Changes in the Inter-
Industry Linkages (pale shade).
68
More intriguing information
1. Reform of the EU Sugar Regime: Impacts on Sugar Production in Ireland2. Knowledge, Innovation and Agglomeration - regionalized multiple indicators and evidence from Brazil
3. Temporary Work in Turbulent Times: The Swedish Experience
4. The name is absent
5. Structural Conservation Practices in U.S. Corn Production: Evidence on Environmental Stewardship by Program Participants and Non-Participants
6. Spatial agglomeration and business groups: new evidence from Italian industrial districts
7. Transport system as an element of sustainable economic growth in the tourist region
8. The name is absent
9. The name is absent
10. Knowledge and Learning in Complex Urban Renewal Projects; Towards a Process Design