Figure 14: Decomposition of Employment Change in the VIS among Final Demand,
Labour Productivity and Structural Change, France 1995 - 1977
10000
8000
-10000
6000
4000
2000
0
-2000
-4000
-6000
-8000
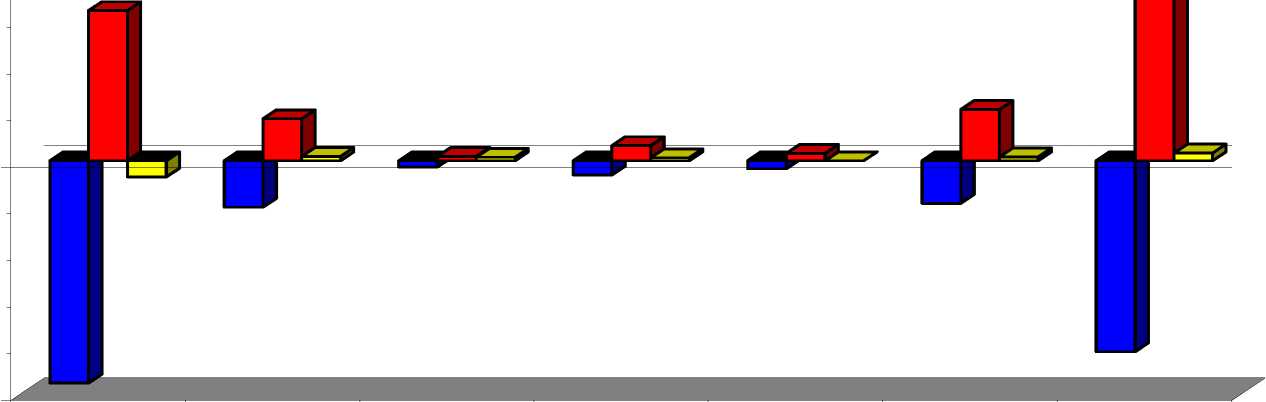
■ PROD
□ DEM
Ointjndjntd
|
TOTAL |
WHOLESALE AND RETAIL TRADE; REPAIRS |
HOTELS AND |
TRANSPORT AND |
POST AND TELECOMMUNICATIONS |
FINANCE, INSURANCE, |
COMMUNITY, SOCIAL |
|
-9547,6523 |
-1993,621 |
-263,7675 |
-613,8798 |
-346,3402 |
-1830,2584 |
-8192,5134 |
|
6438,5727 |
1802,3438 |
193,9394 |
647,1743 |
322,8258 |
2201,189 |
9991,1779 |
|
-693,9255 |
192,9554 |
149,3898 |
131,6867 |
6,1939 |
168,2527 |
329,9514 |
Total Manufacturing comprises: Agriculture (ISIC 1), Mining and Quarrying (ISIC 2), Manufacturing (ISIC3), Public Utilities (ISIC 4), and Construction
(ISIC 5).
PRD: Productivity Growth Effect (Dark Shade, negative), DEM: Demand Growth Effect (Dark Shade, positive), INT_IND_INTD : Effects of Changes in the Inter-
Industry Linkages (pale shade).
67
More intriguing information
1. The name is absent2. The name is absent
3. Evaluating the Success of the School Commodity Food Program
4. The name is absent
5. Strategic Investment and Market Integration
6. Regional science policy and the growth of knowledge megacentres in bioscience clusters
7. Governance Control Mechanisms in Portuguese Agricultural Credit Cooperatives
8. Commuting in multinodal urban systems: An empirical comparison of three alternative models
9. Examining the Regional Aspect of Foreign Direct Investment to Developing Countries
10. Detecting Multiple Breaks in Financial Market Volatility Dynamics