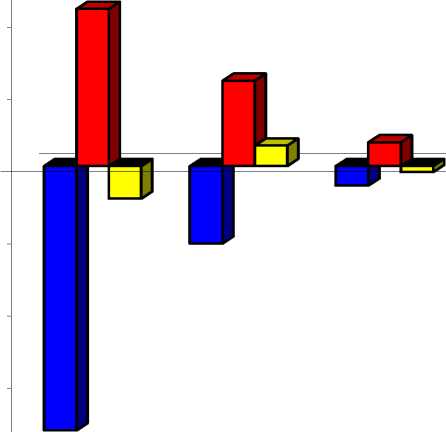
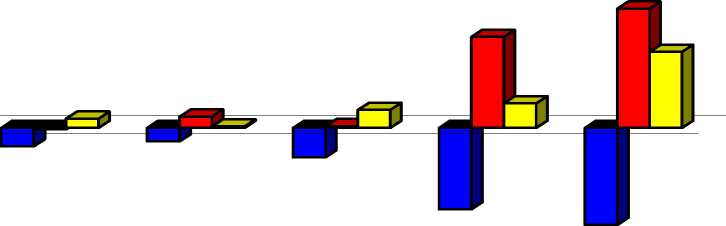
Figure 12: Decomposition of Employment Change in the VIS among Final Demand, Labour
Productivity and Structural Change, UK 1998 - 1979
6000
4000
2000
0
-2000
-4000
-6000
|
-8000 |
TOTAL MANUFACTURING |
WHOLESALE AND RETAIL TRADE; REPAIRS |
HOTELS AND |
TRANSPORT AND |
POST AND |
FINANCE, |
REAL ESTATE AND BukINESS SERVICES |
COMMUNITY, |
|
■ PROD |
-7320,2077 |
-2137,548 |
-539,2278 |
-511,3558 |
-370,7321 |
-817,8075 |
-2260,4581 |
-2688,7464 |
|
ODEM |
4357,5342 |
2368,7545 |
663,3322 |
-37,3188 |
314,1583 |
50,3745 |
2526,6388 |
3310,4236 |
|
OINT_IND_INTD |
-899,3433 |
571,3688 |
-168,0653 |
258,6122 |
41,1431 |
502,027 |
678,9023 |
2110,7899 |
Total Manufacturing comprises: Agriculture (ISIC 1), Mining and Quarrying (ISIC 2), Manufacturing (ISIC3), Public Utilities (ISIC 4), and Construction
(ISIC 5).
PRD: Productivity Growth Effect (Dark Shade, negative), DEM: Demand Growth Effect (Dark Shade, positive), INT_IND_INTD : Effects of Changes in the
Inter-Industry Linkages (pale shade).
65
More intriguing information
1. Graphical Data Representation in Bankruptcy Analysis2. The use of formal education in Denmark 1980-1992
3. Constructing the Phylomemetic Tree Case of Study: Indonesian Tradition-Inspired Buildings
4. Tobacco and Alcohol: Complements or Substitutes? - A Statistical Guinea Pig Approach
5. The magnitude and Cyclical Behavior of Financial Market Frictions
6. Visual Artists Between Cultural Demand and Economic Subsistence. Empirical Findings From Berlin.
7. Benchmarking Regional Innovation: A Comparison of Bavaria, Northern Ireland and the Republic of Ireland
8. Who runs the IFIs?
9. National urban policy responses in the European Union: Towards a European urban policy?
10. The name is absent