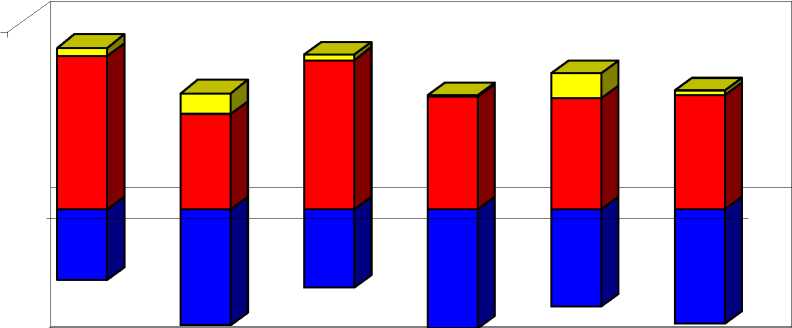
Figure 10b: Decomposition of Employment Change (%) in the VIS among Final Demand,
Labour Productivity and Structural Change, Late 1990s - Late 1970s, All Countries
80%
60% -
40% -
20% -
0%
-20% -
-40% -
|
Till t∩ — |
US |
UK |
GERMANY |
FRANCE |
NL |
SPAIN |
|
∏INTJNDJNT |
3636,4175 |
3095,4348 |
621,0599 |
28 4,50 47 |
712,0563 |
1168,8521 |
|
□ DEM |
60053,6284 |
13553,8 9 71 |
16100,2261 |
21597,2228 |
3112,4387 |
26427,1848 |
|
BPRD______ |
-27998,2388 |
-16646,0834 |
-8402,5927 |
-22788,0325 |
-2750,8559 |
-26600,1239 |

PRD: Productivity Growth Effect (Dark Shade, negative), DEM: Demand Growth Effect (Dark Shade, positive), INT_IND_INTD : Effects of Changes in the Inter-
Industry Linkages (pale shade).
63
More intriguing information
1. Discourse Patterns in First Language Use at Hcme and Second Language Learning at School: an Ethnographic Approach2. Linkages between research, scholarship and teaching in universities in China
3. Volunteering and the Strategic Value of Ignorance
4. Dendritic Inhibition Enhances Neural Coding Properties
5. Understanding the (relative) fall and rise of construction wages
6. Internationalization of Universities as Internationalization of Bildung
7. The name is absent
8. The name is absent
9. The name is absent
10. Conflict and Uncertainty: A Dynamic Approach