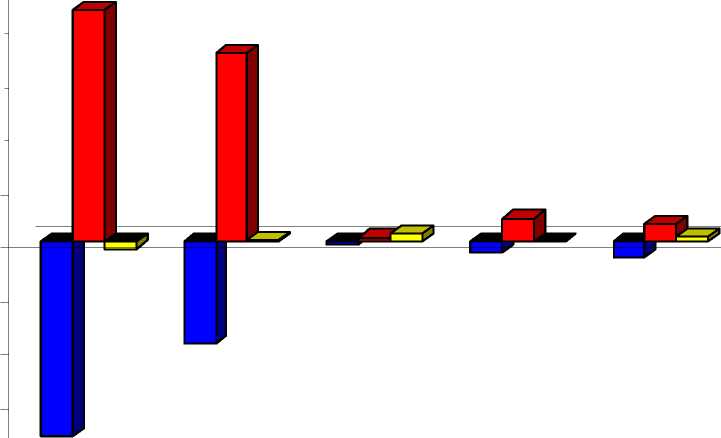
Figure 11: Decomposition of Employment Change in the VIS among Final Demand, Labour Productivity and
Structural Change, US 1997 - 1977
25000
20000
15000
10000
5000
0
-5000
-10000
-15000

|
-20000 |
TOTAL M ANUFACTURING |
WHOLESALE AND RETAIL TRADE; REPAIRS |
HOTELS AND RESTAURANTS |
TRANSPORT AND |
POST AND |
FINANCE, |
REAL ESTATE AND BUSINESS SERVICES |
COM M UNITY, |
|
■ PROD |
-18234,0711 |
-9560,4721 |
-197,2741 |
-988,2594 |
-1437,6619 |
-721,2134 |
304,2215 |
2836,4916 |
|
□ DEM |
21727,8949 |
17722,8171 |
396,5494 |
2205,4474 |
1626,233 |
2560,508 |
5691,4284 |
8122,75 |
|
□ INT_IND_INTD |
-640,592 |
191,8618 |
752,3395 |
-28,2978 |
421,4835 |
843,9481 |
676,6315 |
1419,0431 |
Total Manufacturing comprises: Agriculture (ISIC 1), Mining and Quarrying (ISIC 2), Manufacturing (ISIC3), Public Utilities (ISIC 4), and Construction
(ISIC 5).
PRD: Productivity Growth Effect (Dark Shade, negative), DEM: Demand Growth Effect (Dark Shade, positive), INT_IND_INTD : Effects of Changes in the
Inter-Industry Linkages (pale shade).
64
More intriguing information
1. The name is absent2. Perceived Market Risks and Strategic Risk Management of Food Manufactures: Empirical Results from the German Brewing Industry
3. Regional specialisation in a transition country - Hungary
4. The name is absent
5. The name is absent
6. Survey of Literature on Covered and Uncovered Interest Parities
7. Whatever happened to competition in space agency procurement? The case of NASA
8. The name is absent
9. Measuring and Testing Advertising-Induced Rotation in the Demand Curve
10. GOVERNANÇA E MECANISMOS DE CONTROLE SOCIAL EM REDES ORGANIZACIONAIS