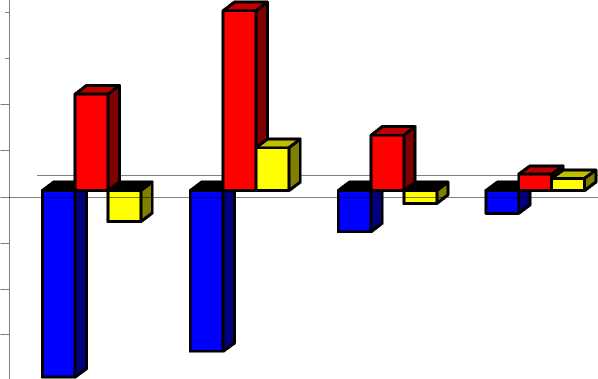
Figure 18: Decomposition of Employment Change in the VIS due to Consumption among
Demand, Labour Productivity and Structural Change, UK 1998 - 1979
2500
-2000
2000
1500
1000
500
0
-500
-1000
-1500


|
-2500 | |||||||||
|
TOTAL MANUFACTURING |
WHOLESALE AND RETAIL TRADE; REPAIRS |
HOTELS AND |
TRANSPORT AND |
POST AND TELECOMMUNICATIONS |
FINANCE, INSURANCE |
REAL ESTATE AND |
COMMUNITY, SOCIAL | ||
|
■ PROD |
-2024,6759 |
-1744,683 |
-445,1414 |
-246,8956 |
-289,3295 |
-463,7192 |
-1411,458 |
-1388,7014 |
|
■ DEM |
1047,0586 |
1952,0669 |
602,4362 |
177,6276 |
319,2134 |
536,4731 |
2037,2826 |
296,247 |
|
Dintjndjntd |
-335,5902 |
466,8162 |
-139,0685 |
131,6761 |
34,3994 |
309,7381 |
443,8076 |
1066,2153 |
Total Manufacturing comprises: Agiculture (ISIC 1), Mining and Quarrying (ISIC 2), Manufacturing (ISIC 3), Public Utilities (ISIC 4), Construction (ISIC
5)
PRD: Productivity Growth Effect (Darj Shade, negative), DEN: Demand Growth Effect (Dark Shade, positive), INT_IND: Industry Linkages (pale
shade).
71
More intriguing information
1. Are combination forecasts of S&P 500 volatility statistically superior?2. Restricted Export Flexibility and Risk Management with Options and Futures
3. Regional dynamics in mountain areas and the need for integrated policies
4. How Offshoring Can Affect the Industries’ Skill Composition
5. Review of “From Political Economy to Economics: Method, the Social and Historical Evolution of Economic Theory”
6. Enterpreneurship and problems of specialists training in Ukraine
7. A parametric approach to the estimation of cointegration vectors in panel data
8. Internationalization of Universities as Internationalization of Bildung
9. Evolution of cognitive function via redeployment of brain areas
10. Valuing Farm Financial Information