Figure 2. Farm diversification
1992
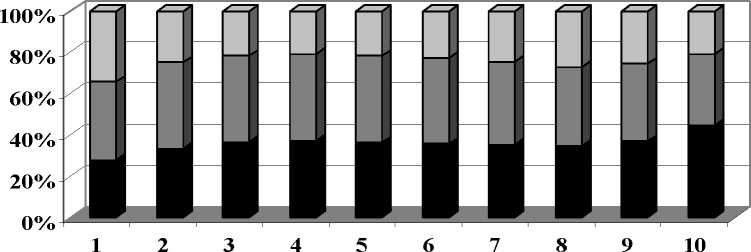
■ 90-100% □ 75-89.9% □ 50-74.9% □ Less than 50%
1997
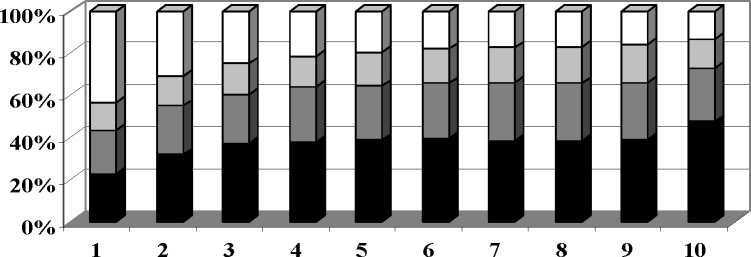
■ 90-100% □ 75-89.9% □ 50-74.9% □ Less than 50%
2002
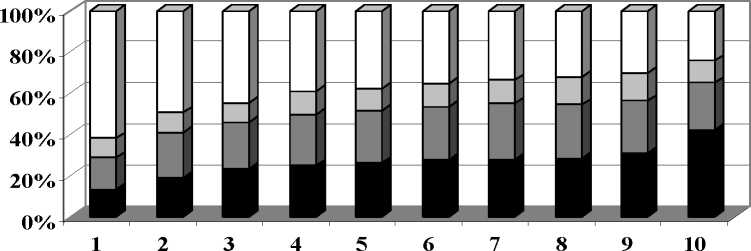
■ 90-100% □ 75-89.9% □ 50-74.9% □ Less than 50%
24
More intriguing information
1. Notes on an Endogenous Growth Model with two Capital Stocks II: The Stochastic Case2. Globalization and the benefits of trade
3. Secondary stress in Brazilian Portuguese: the interplay between production and perception studies
4. PROTECTING CONTRACT GROWERS OF BROILER CHICKEN INDUSTRY
5. The name is absent
6. The name is absent
7. Sectoral specialisation in the EU a macroeconomic perspective
8. The name is absent
9. El Mercosur y la integración económica global
10. Second Order Filter Distribution Approximations for Financial Time Series with Extreme Outlier