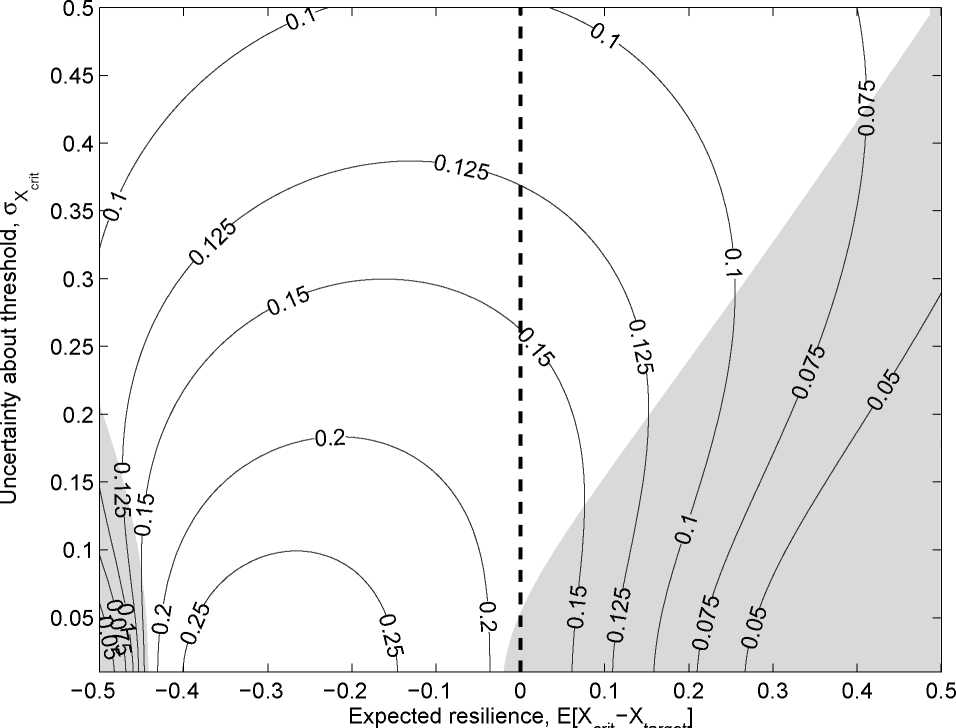
Figure 2: Contour map of precautionary reduction in loading, E [Xtarget — Xt+1 ], under uncertainty.
crit target
Notes: Graph displays contour sets of precautionary reductions in loading as a function of the system resilience
Xc — Xtarget and uncertainty about the critical level, σXc , with other parameter values as in Figure 1. The areas
shaded gray represent regions of the parameter space for which increasing uncertainty about the expected resilience of
the system leads to a reduction in loading. Unshaded areas represent regions for which increasing uncertainty about
expected resilience leads to an increase in loading. The dotted line separates the two states of the ecosystem, with the
desirable state on the right-hand side and the undesirable state on the left-hand side. Thus, increasing positive values
of expected resilience refer to increasing resilience of the desirable state, and increasing negative values of expected
resilience refer to increasing resilience of the undesirable state.
25
More intriguing information
1. Education as a Moral Concept2. Pupils’ attitudes towards art teaching in primary school: an evaluation tool
3. The name is absent
4. The name is absent
5. Wage mobility, Job mobility and Spatial mobility in the Portuguese economy
6. El impacto espacial de las economías de aglomeración y su efecto sobre la estructura urbana.El caso de la industria en Barcelona, 1986-1996
7. Improving Business Cycle Forecasts’ Accuracy - What Can We Learn from Past Errors?
8. The name is absent
9. Life is an Adventure! An agent-based reconciliation of narrative and scientific worldviews
10. Can genetic algorithms explain experimental anomalies? An application to common property resources