Figure 1 : Optimal Loading and Expected Pollutant Stock under Certainty for Various σv
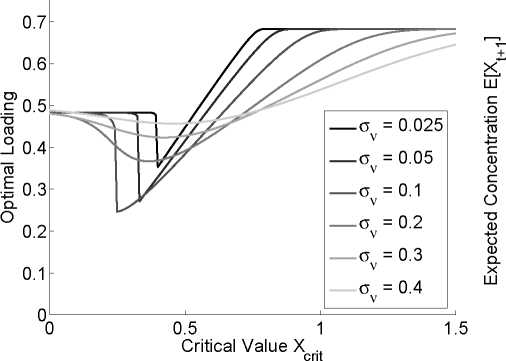
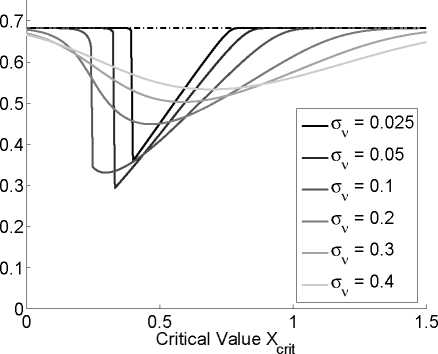
Notes: The left graph displays the optimal loading c = BX +1 + b as a function of the critical value Xc, the right graph
displays the next period’s expected pollutant stock E[Xt+1] as a function of Xc. The constant target level Xtarget, the
expected level in the next period if a manager were to assume that the system is in either state with certainty (i.e. above
or below the critical value without a chance of switching) is added as a dotted line to the right panel. For limXc→-∞
and limXc→∞, the expected stock approaches this target level Xtarget. However, if this target level is close to the
critical level X , additional precaution is optimal to avoid transition to the undesirable state. Parameter values used
follow Peterson et al. [25] where: k = 1.5, δ = 0.99, B = 0.1, b = 0.02, r = 0.2, σv2 = 0.02.
24
More intriguing information
1. The name is absent2. The name is absent
3. Public Debt Management in Brazil
4. Group cooperation, inclusion and disaffected pupils: some responses to informal learning in the music classroom
5. SAEA EDITOR'S REPORT, FEBRUARY 1988
6. The name is absent
7. Tax Increment Financing for Optimal Open Space Preservation: an Economic Inquiry
8. Cultural Neuroeconomics of Intertemporal Choice
9. Retirement and the Poverty of the Elderly in Portugal
10. The name is absent