-45 -
Figure 1 Evolution of International Financial Integration, 1983-2001
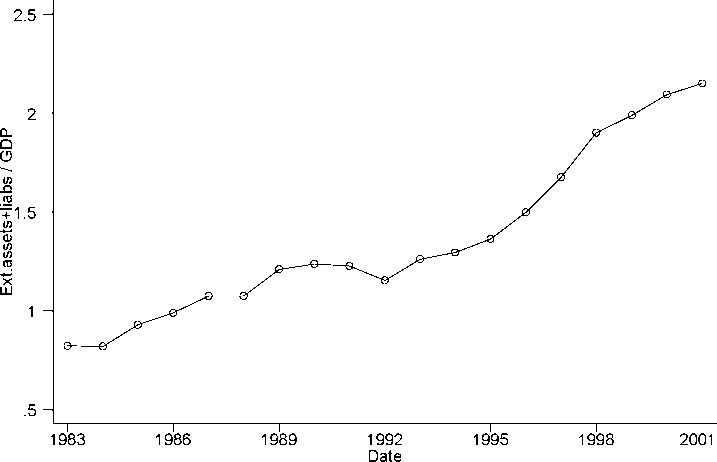
Figure 2 Dispersion in Level of International Financial Integration, 1983-2001
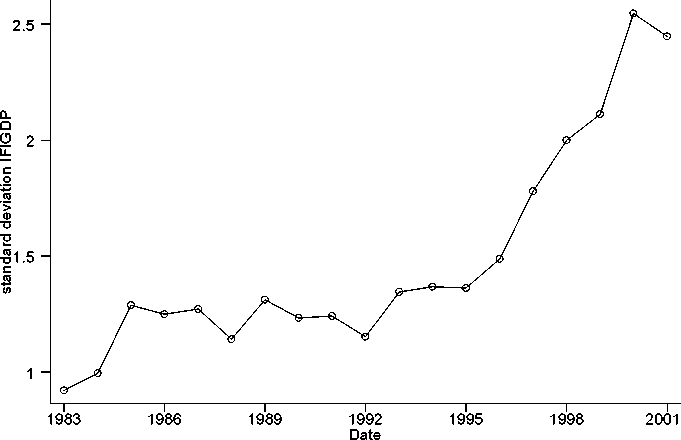
Note: Figure 1 plots the aggregate sum of external assets and liabilities over aggregate GDP.
Figure 2 plots the standard deviation of IFIGDP ratio. Countries in the sample are the United
States, United Kingdom, Austria, Belgium, Germany, Italy, Netherlands, Norway, Sweden,
Switzerland, Canada, Japan, Finland, and Spain.
More intriguing information
1. Partner Selection Criteria in Strategic Alliances When to Ally with Weak Partners2. The name is absent
3. Experimental Evidence of Risk Aversion in Consumer Markets: The Case of Beef Tenderness
4. The name is absent
5. Recognizability of Individual Creative Style Within and Across Domains: Preliminary Studies
6. IMPLICATIONS OF CHANGING AID PROGRAMS TO U.S. AGRICULTURE
7. The Impact of Hosting a Major Sport Event on the South African Economy
8. Human Resource Management Practices and Wage Dispersion in U.S. Establishments
9. Pass-through of external shocks along the pricing chain: A panel estimation approach for the euro area
10. Testing Hypotheses in an I(2) Model with Applications to the Persistent Long Swings in the Dmk/$ Rate