9.6
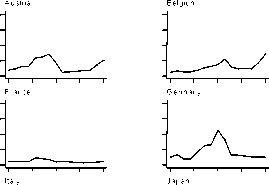
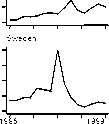
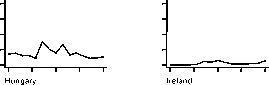
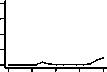
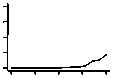
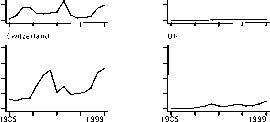
Figure 2: Relative Asylum Burdens, 1985-99
Portugal Spain
1985 ' ' ' 1 999l 1985 ' ' ' 1999,
Czech Rep.
Greece

Netherlands
Denmark Finland
Norway
Poland
The results of the regression analysis are presented in Table 3. We find
that some historic, economic and political pull-factors have a strong
impact on the distribution of asylum applications. There is also evidence
that the relative leniency or restrictiveness of a country’s asylum policy
(expressed in the deterrence index) has a highly significant effect on the
number of applications received. However, it will be shown below that the
impact of the different policy measures that make up that index is highly
varied.
Table 3: Determinants for the Relative Number of Asylum Applications
|
Expected Sign |
Coef_______ |
z_________ | |
|
Number of Unemployed (lagged) |
- |
-.0007394 |
-7.49*** |
|
GDP growth (lagged) |
+ |
.0023206 |
0.12 |
|
Stock of Foreign Nationals (lagged) |
+ |
.0012462 |
8.20*** |
|
Relative ODA Payments |
+ |
1270083 |
2.88*** |
|
Average Distance |
- |
0.00000382 |
0.08 |
|
Deterrence Index |
- |
-.2266697 |
-2.56*** |
N=227; R-squared = 0.41; ***p<0.01
24
More intriguing information
1. The East Asian banking sector—overweight?2. Who runs the IFIs?
3. The name is absent
4. Strategic Policy Options to Improve Irrigation Water Allocation Efficiency: Analysis on Egypt and Morocco
5. SOCIOECONOMIC TRENDS CHANGING RURAL AMERICA
6. Wirtschaftslage und Reformprozesse in Estland, Lettland, und Litauen: Bericht 2001
7. The storage and use of newborn babies’ blood spot cards: a public consultation
8. The name is absent
9. The name is absent
10. Pricing American-style Derivatives under the Heston Model Dynamics: A Fast Fourier Transformation in the Geske–Johnson Scheme