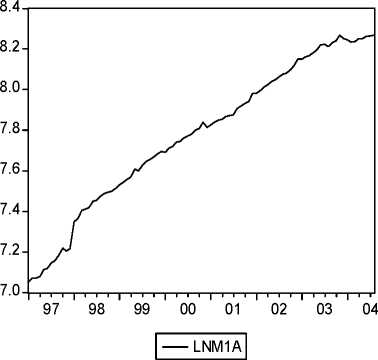
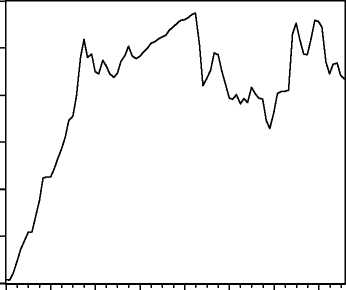
Figure 2. The logs of seasonally adjusted money supply and exchange rate
5.60
5.55
5.50
5.45
5.40
5.35
5.30
97 98 99 00 01 02 03 04
I — Lnxreuro |
4.1. Stationarity and integration tests
First, the Elliott, Rothenberg, Stock (1996) DF-GLS unit root test, with and without a linear
trend is performed. The results are presented in Table 1.
Table 1. DF-GLS unit root tests
|
Variables |
Specification |
Lags |
Test statistic |
|
lnIPI |
constant |
5 |
- 0.904 |
|
constant and trend |
5 |
- 2.997 | |
|
lnPPI |
constant |
3 |
- 1.722 |
|
constant and trend |
3 |
- 2.349 | |
|
lnM1A |
constant |
5 |
0.366 |
|
constant and trend |
5 |
- 0.697 | |
|
InXREURO |
constant |
2 |
-0.264 |
|
constant and trend |
2 |
- 0.931 |
The critical values for 0.95 (0.99) confidence levels with constant are -1.944 (-2.592), with constant and trend
are -3.074 (-3.633). The Akaike Information Criteria was used to determine the lag length.
None of the tests statistics is significant, all the variables appears to be integrated. To ensure
that all series are I(1), and not integrated of a higher order, the first differences are tested
using the DF-GLS unit root tests in table 2. Because there is no evidence of a linear trend in
the first difference representation of the variables, we conduct the second order unit root tests
More intriguing information
1. Fiscal federalism and Fiscal Autonomy: Lessons for the UK from other Industrialised Countries2. The name is absent
3. The Formation of Wenzhou Footwear Clusters: How Were the Entry Barriers Overcome?
4. Testing Gribat´s Law Across Regions. Evidence from Spain.
5. The name is absent
6. Modellgestützte Politikberatung im Naturschutz: Zur „optimalen“ Flächennutzung in der Agrarlandschaft des Biosphärenreservates „Mittlere Elbe“
7. Determinants of U.S. Textile and Apparel Import Trade
8. Evolution of cognitive function via redeployment of brain areas
9. Heavy Hero or Digital Dummy: multimodal player-avatar relations in FINAL FANTASY 7
10. Consumer Networks and Firm Reputation: A First Experimental Investigation