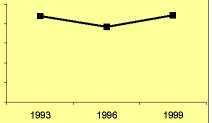
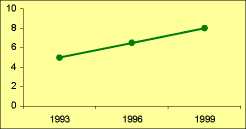
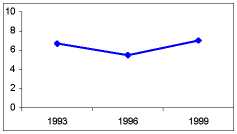
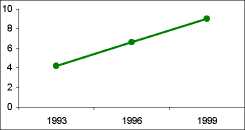
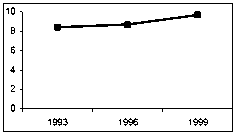
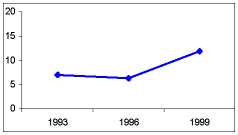
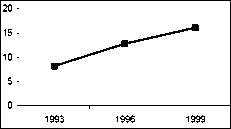
Figure 6: Percentage of Workforce Which Are Graduates: All Manufacturing
Plants
Northern Ireland
Republic of Ireland
Bavaria
Overall

10
8
6
4
2
0
20-99
10
8
6
4
2
0

1993
1996
|
10 8 6 4 2 0 |
*----------* |
|
1993 1996 1999 |
1999
|
10 8 6 4 2 0 |
____________________* |
|
1993 1996 1999 |
500 Plus
|
20 15 10 5 0 |
•--------∙--------- |
|
1993 1996 1999 |
32
More intriguing information
1. Death as a Fateful Moment? The Reflexive Individual and Scottish Funeral Practices2. Review of “The Hesitant Hand: Taming Self-Interest in the History of Economic Ideas”
3. A Rare Presentation of Crohn's Disease
4. An alternative way to model merit good arguments
5. The Evolution
6. The name is absent
7. The name is absent
8. The name is absent
9. The name is absent
10. Business Networks and Performance: A Spatial Approach