A THEORETICAL GROWTH MODEL FOR IRELAND
259
or early 1990s that raised the long-run path of Irish GDP per capita. According
to the neo-classical growth model, this would lead to a rise in growth rates as
the economy converged to the higher growth path. While the long run growth
rate would be unchanged, the level of GDP per capita would be permanently
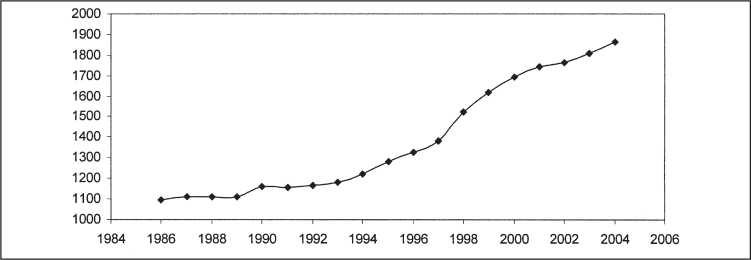
higher at all dates. At the same time, total employment, as illustrated in
Figure 7, increased dramatically. Between 1986 and 2004 employment
increased by 72 per cent (from around 1.1 million to 1.8 million). This was of
course the result of many factors; increased labour force participation, net in-
migration, and a collapse in unemployment.
Figure 7: Employment (thousands)

Can our model assist in the interpretation of the Irish growth experience?
We have discussed three sources of growth shocks. How important could each
shock be in explaining the historical growth record? Table 1 gives some
indication of this. It documents the impact on GDP and employment of a fall
in the external risk premium, a shift in aggregate labour supply (due to labour
market reform), and a rise in total factor productivity. A fall in the risk
premium leads to an increase in long run GDP and employment. But the
Table 1: Steady State Effects of Shocks
|
r* |
Θ |
A |
A(1) |
A(2) |
A(3) | |
|
% |
% |
% |
% |
% |
% | |
|
Output |
15 |
14 |
33 |
200 |
77 |
194 |
|
Employment |
7 |
14 |
14 |
70 |
0 |
68 |
Notes: r* indicates a shock that cuts the external real interest rate by half. Θ represents
a labour market shock that directly increases employment by 10 per cent. A represents
a 10 per cent increase in total factor productivity. A(1) represents a shock that raises
GDP by 200 per cent and increases employment by 70 per cent, as in the data. A(2)
represents the same shock when there is no endogenous labour supply. A(3) represents
the same shock when the debt elasticity of external interest rates is increased from .01
to .1.
More intriguing information
1. Evolution of cognitive function via redeployment of brain areas2. The name is absent
3. Sectoral specialisation in the EU a macroeconomic perspective
4. A THEORETICAL FRAMEWORK FOR EVALUATING SOCIAL WELFARE EFFECTS OF NEW AGRICULTURAL TECHNOLOGY
5. An Efficient Circulant MIMO Equalizer for CDMA Downlink: Algorithm and VLSI Architecture
6. Testing the Information Matrix Equality with Robust Estimators
7. Foreign Direct Investment and the Single Market
8. Food Prices and Overweight Patterns in Italy
9. The name is absent
10. The Formation of Wenzhou Footwear Clusters: How Were the Entry Barriers Overcome?