228
Figure 7.2.2: Mean scores of 8th graders’ sense of security promoted by teaching
methods according to their attribution styles of success in mathematics learning
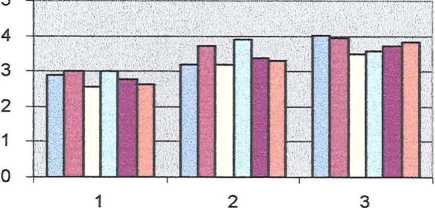
□ A b і I it у
□ E ffo rt
□ Luck
□ Teacher support
□ Home support
□ Task easiness
I=Reading a textbook, 2=Teacher explanation, S=IndividuaI work
5th graders’ affective attitudes towards mathematics learning as promoted by different
teaching methods, overall, did not vary according to their attribution of failure in
mathematics learning. However, 5th graders attributing their failure in mathematics
learning to lack of teacher support perceived that Teacher explanation could promote
positive affective attitudes towards mathematics learning less. In contrast, 5th graders
attributing their failure in mathematics learning to lack of effort, task difficulty or lack of
luck perceived Teacher explanation more positively (Table 7.2.3 and Figure 7.2.3). 5th
grader’s perceptions of the frequency of deployment of each teaching method did not
vary according to the way they attributed their failure (also see appendices Table
7.2.11).
Table 7.2.3: 5th graders’ affective attitudes towards mathematics learning promoted by
Teacher explanation varying ac∞rding to their attribution styles Offailure in mathematics
learning_________________________________________________________________________________
|
Enjoyment |
Motivation_________ |
Senseofsecurity |
Sense of proc |
less | ||||||||
|
N |
M |
SD |
N |
M |
SD |
N |
M |
SD |
N |
M__ |
SD | |
|
Lack of ability |
88 |
2.93 |
1.28 |
88 |
2.77 |
1.32 |
88 |
2.75 |
1.38 |
88 |
3.08 |
1.44 |
|
Lackofeffort |
97 |
3.53 |
1.25 |
97 |
3.08 |
1.33 |
97 |
3.23 |
1.34 |
97 |
3.45 |
1.38 |
|
Lack of luck |
9 |
3.33 |
1.80 |
___9 |
3.11 |
1.76 |
___9 |
3.67 |
1.66 |
9 |
4.11 |
1.36 |
|
Lack of teacher |
7 |
1.43 |
1.13 |
7 |
1.14 |
.38 |
7 |
1.29 |
.76 |
7 |
1.29 |
.76 |
|
Lackof Home support |
10 |
2.50 |
1.51 |
10 |
2.50 |
1.18 |
10 |
2.30 |
1.42 |
10 |
2.80 |
1.32 |
|
Task difficulty |
34 |
3.38 |
1.28 |
34 |
3.38 |
1.44 |
34 |
3.26 |
1.38 |
34 |
3.68 |
1.41 |
|
ANOVA______ |
F=5,317, p<.01 |
F=4.0 |
6, p<.01 |
F=4.535, p<.01 |
F=4.984, p<.C |
1________ | ||||||
228
More intriguing information
1. Measuring and Testing Advertising-Induced Rotation in the Demand Curve2. Testing for One-Factor Models versus Stochastic Volatility Models
3. The name is absent
4. The Economics of Uncovered Interest Parity Condition for Emerging Markets: A Survey
5. The name is absent
6. Intertemporal Risk Management Decisions of Farmers under Preference, Market, and Policy Dynamics
7. The name is absent
8. The name is absent
9. Midwest prospects and the new economy
10. The name is absent