achieve the 50 per cent that of the level of 1990. The greatest slump was registered in the
consumer goods industry, 22 per cent of the level of 1990, construction materials - 23 per cent,
machine- building - 31 per cent, foodstuff - 36 per cent operating capacities. (Table 4; Chart 2).
Table 4: Industrial Output of Ukraine by Sectors
(per cent to 1990)
|
1990 |
1991 |
1992 |
1993 |
1994 |
1995 |
1996 |
1997 | |
|
Industry - total |
100 |
95,0 |
89,3 |
82,2 |
59,0 |
51,9 |
49,3 |
48,4 |
|
Electrical Energy |
100 |
96,0 |
90,2 |
84,8 |
74,2 |
69,8 |
64,9 |
63,2 |
|
Fuel |
100 |
89,0 |
76,5 |
58,9 |
48,8 |
43,9 |
40,8 |
42,7 |
|
Ferrous Metallurgy |
100 |
88,0 |
79,2 |
60,2 |
42,9 |
40,7 |
45,6 |
49,1 |
|
Machine-Building and | ||||||||
|
Metal Processing |
100 |
104,0 |
99,8 |
105,8 |
60,4 |
45,9 |
32,6 |
31,4 |
|
Chemical and Petrochemical |
100 |
93,0 |
80,9 |
60,7 |
44,7 |
40,6 |
39,3 |
39,0 |
|
Wood and Wood | ||||||||
|
Processing |
100 |
102,0 |
103,0 |
99,9 |
65,1 |
54,0 |
43,7 |
41,5 |
|
Building Materials |
100 |
101,0 |
97,0 |
82,4 |
52,7 |
38,0 |
25,1 |
23,1 |
|
Consumer Goods |
100 |
97,0 |
101,9 |
88,6 |
46,6 |
31,2 |
23,4 |
22,2 |
|
Food Processing |
100 |
87,0 |
74,0 |
65,1 |
52,3 |
45,5 |
42,3 |
36,1 |
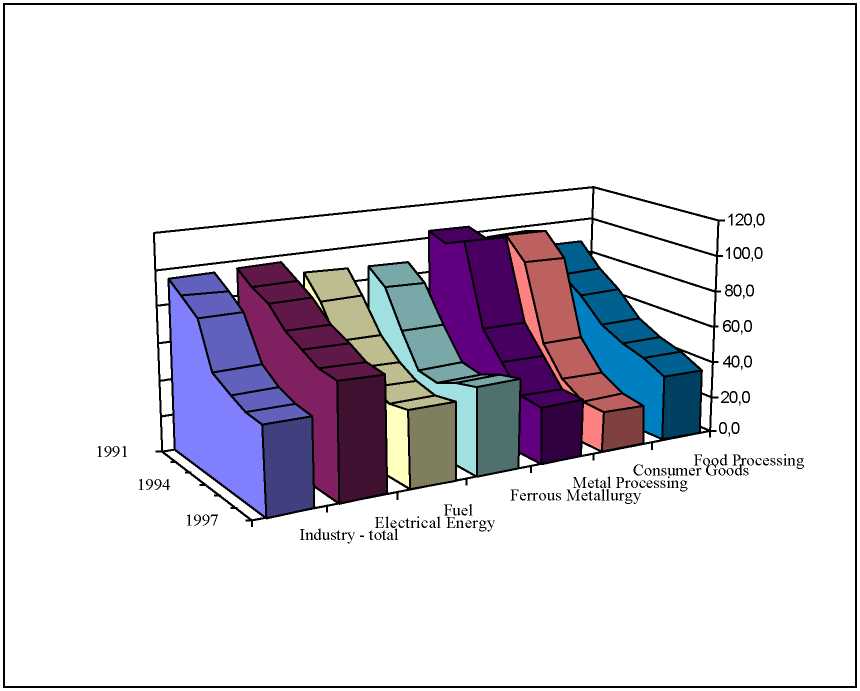
Chart 2. Industrial Output of Ukraine by Sectors, per cent to 1990
More intriguing information
1. Modeling industrial location decisions in U.S. counties2. A Rare Case Of Fallopian Tube Cancer
3. The name is absent
4. The name is absent
5. The name is absent
6. Are class size differences related to pupils’ educational progress and classroom processes? Findings from the Institute of Education Class Size Study of children aged 5-7 Years
7. AN IMPROVED 2D OPTICAL FLOW SENSOR FOR MOTION SEGMENTATION
8. The name is absent
9. The name is absent
10. Orientation discrimination in WS 2