This general trend has hit most of the Swedish municipalities or local labour markets in form
of net out-migration. In 1990, 62 out of 284 municipalities showed net out-migration - the
corresponding figure for 1999 were 189. As elderly people have low migration intensities the
result will be an accentuated lop-sided age structure. This is a well-known experience for
many Swedish municipalities and local labour markets but it has now been even more
accentuated according to the low birth rates all through the country.
Connection between net-migration 1990 (X-axis) and 1999 (Y-axis)
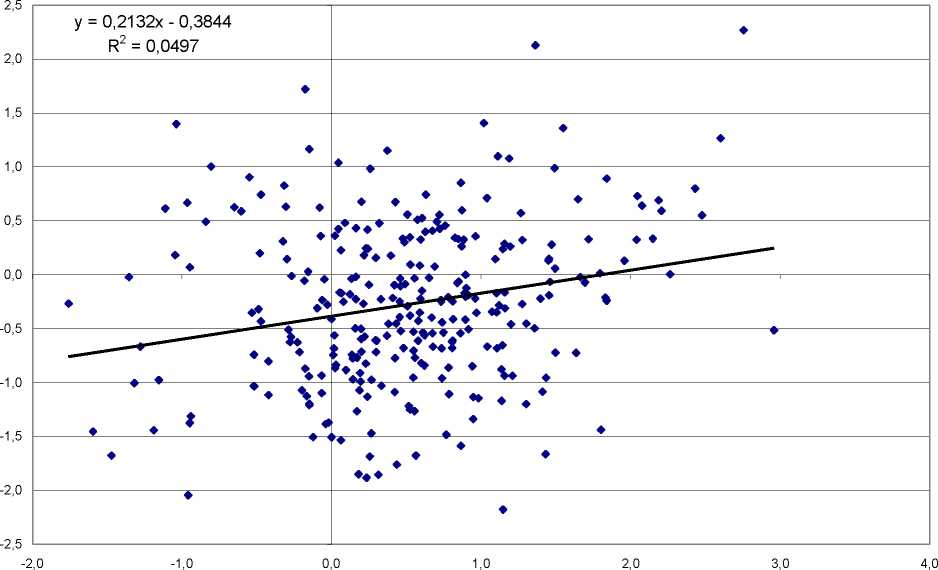
Figure 1. Connection between net-migration 1990 (X-axis) and 1999 (Y-axis) with regard to
284 Swedish municipalities.
CREATING LOCAL LABOUR MARKETS
The municipality level is not the best division when migratory movements with relevance to
labour market conditions. Instead 109 functional local labour markets (LLMs) have been
created. The point of departure in the creation of LLMs is the 284 municipalities that existed
in the beginning of the 90s. This means also that changes in the number of municipalities have
been standardised according to the municipality structure and the commuting conditions of
1988 - the year when the first division in LLMs were done (Carlsson et.al., 1993).
More intriguing information
1. A simple enquiry on heterogeneous lending rates and lending behaviour2. The name is absent
3. The name is absent
4. The Environmental Kuznets Curve Under a New framework: Role of Social Capital in Water Pollution
5. EXECUTIVE SUMMARIES
6. The Response of Ethiopian Grain Markets to Liberalization
7. Industrial districts, innovation and I-district effect: territory or industrial specialization?
8. Large Scale Studies in den deutschen Sozialwissenschaften:Stand und Perspektiven. Bericht über einen Workshop der Deutschen Forschungsgemeinschaft
9. Optimal Tax Policy when Firms are Internationally Mobile
10. The Dynamic Cost of the Draft