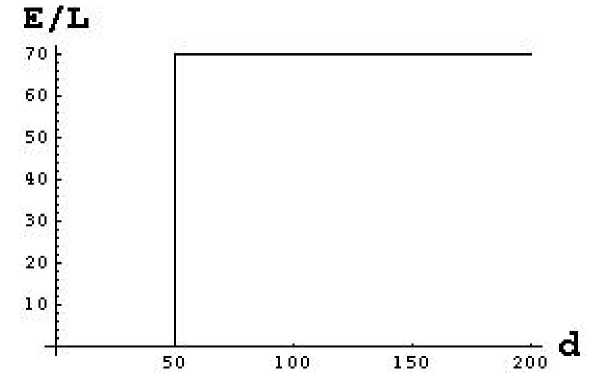
Figure 2
Fractions of Employment/Labor as a
function of traveling distance d to CBD
In Figure 2, E1=70, and we have
assumed a price reduction of 10 in the
CBD, counteracted by a constant
traveling cost TC= 0.1$/km. To take
the model one step further, we
consider a collection of N different
types of stores and goods,
F1,F2,...,FN, each of which requiring E1, E2 ,...,EN employees to serve 1000 customers. Each different
type of store Fi can offer a price reduction PRi in the CBD, i=1,2,...,N. Without loss of generality,
we can assume that the different types of stores have been sorted in such a way that the price
reductions increase with i. We keep the basic assumption that the customers do their shopping
locally by Fi if TCdistance = PRi, i=1,2,...,N, and at the CBD otherwise. Note, however, that if the
customers benefit from more than one good at the same time the total savings from traveling to the
CBD might exceed the traveling cost even when each saving is separately exceeded by TC. We will
deal with this case of multipurpose shopping later. An example with 3 different types of firms is
shown in Figure 3.
E∕L
120
ιoo
sc
so
4G
20
50
1 00
150
Figure 3
Fractions of Employment/Labor as a
function of traveling distance d to CBD
In Figure 3 we have put E1=70,
E2=40, E3=25, PR1=$10, PR2=$20,
PR3= $30 and TC=0.1$/km. As a next
step we replace the constant TC by a
random variable. Traveling to the
CBD has an important time
component, and the value of time
savings relates to the wage level. Hence, traveling costs can be expected to vary considerably over
the population. In the following we will assume that wages are distributed according to a probability
distribution carrying a (usually continuous) density Ψ=Ψ[w], where w denotes the wage level and
Ψ 0 on (-8,0). The relationship between wage and the valuation of time naturally depends on trip
purpose. Norwegian authorities recommend that an hour spent on journey-to-work should be
evaluated by NOK 46, see Hândbok-140 (1995). This estimate is based on information of average
hourly earnings in manufacturing in 1995. To be more precise NOK 46 represents roughly 42% of
the hourly earnings. The estimate of NOK 46 corresponds reasonably well to empirically based
estimates in Tretvik (1995). Tretvik (1995) in addition estimates the value of time for different
income groups. The numerical experiments to be carried out in this paper are based on an
assumption that the value of time savings represents a constant fraction of the wage level. This is
assumed to apply for any trip purpose. The recommendations of Norwegian transportation
More intriguing information
1. El impacto espacial de las economías de aglomeración y su efecto sobre la estructura urbana.El caso de la industria en Barcelona, 1986-19962. The name is absent
3. THE INTERNATIONAL OUTLOOK FOR U.S. TOBACCO
4. Policy Formulation, Implementation and Feedback in EU Merger Control
5. The name is absent
6. Consciousness, cognition, and the hierarchy of context: extending the global neuronal workspace model
7. THE CHANGING RELATIONSHIP BETWEEN FEDERAL, STATE AND LOCAL GOVERNMENTS
8. Estimating the Technology of Cognitive and Noncognitive Skill Formation
9. Towards a framework for critical citizenship education
10. Unemployment in an Interdependent World