unit vector, but also its neighbourhood according to a decreasing function (fig 1b).
SOM NN on square grids of 9,16, 25 nodes have been trained to group the data. The
more explaining output was obtained with a 4x4 nodes grid; this resulted the best in
order to show each group sufficiently different from each other.
c12 c13 c14

c21 c22 c23 c24

c33
CR80 Cell, residential, 1980
CP80 Cell, productive, 1980
CC80 Cell, commercial, 1980
RD Road distance
NR80 Neighbourhood, residential, 1980
NP80 Neighbourhood, productive, 1980
NC80 Neighbourhood, commercial, 1980
CR94 Cell, residential, 1994
CP94 Cell, productive, 1994
CC94 Cell, commercial, 1994
c43
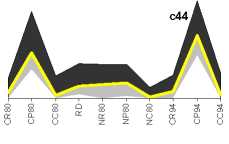
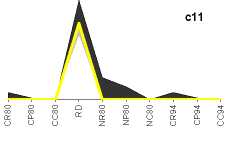
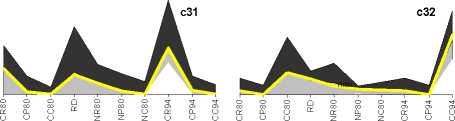
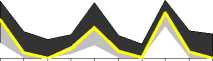
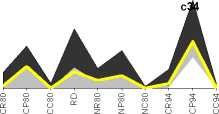
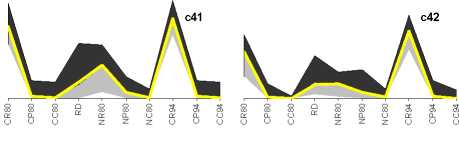
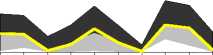
I Codebooks range, values over the mean
Codebooks range, values under the mean
—— Codebook
Figure 2 - The codebooks
The spatial analysis carried out by SOM has been displayed by:
• cluster profiles and their codebook;
• charts with colour hatched plot of the zones, based on output units assignment.
In figure 2 all the codebooks, as prototypical profiles of each cluster, shows the most
relevant features in land use dynamics. On the x-axis are the variables, on the y-axis
their activation level. On the figure is charted the envelope of the records assigned to
each single cluster and, in yellow line, the codebook.
The colour map (Fig.3) shows the spatial organisation of the classes; it is crucial to
know if cells belonging to the same class are also spatially clustered, or if similar
More intriguing information
1. Fiscal Sustainability Across Government Tiers2. Pupils’ attitudes towards art teaching in primary school: an evaluation tool
3. The economic value of food labels: A lab experiment on safer infant milk formula
4. Conservation Payments, Liquidity Constraints and Off-Farm Labor: Impact of the Grain for Green Program on Rural Households in China
5. Multi-Agent System Interaction in Integrated SCM
6. Stable Distributions
7. Emissions Trading, Electricity Industry Restructuring and Investment in Pollution Abatement
8. The name is absent
9. The name is absent
10. Conflict and Uncertainty: A Dynamic Approach