dynamic behaviour affects cells scattered in the territory.
In Fig.2, the first row (CL 1-1 ÷ CL 1-4) shows groups of stable (in the period)
agricultural areas; but moving right along the first row the level of naturality is
decreasing; no significant different land uses are taking place but the mean distance to
the roads drops showing potential “risk” of urbanisation. In Fig. 3 and CL 1-3 and 1-4
free cells are close to urbanised areas.
Shifting from CL 1-1 along the column an increasing road equipment copes with new
residential settlements, which, in CL 4-1 infill the consolidated urban centres.
In the fourth column the industrial land use dynamics emerges both in less
infrastructured and isolated areas (CL 3-4) and near the exiting ones. Looking in the
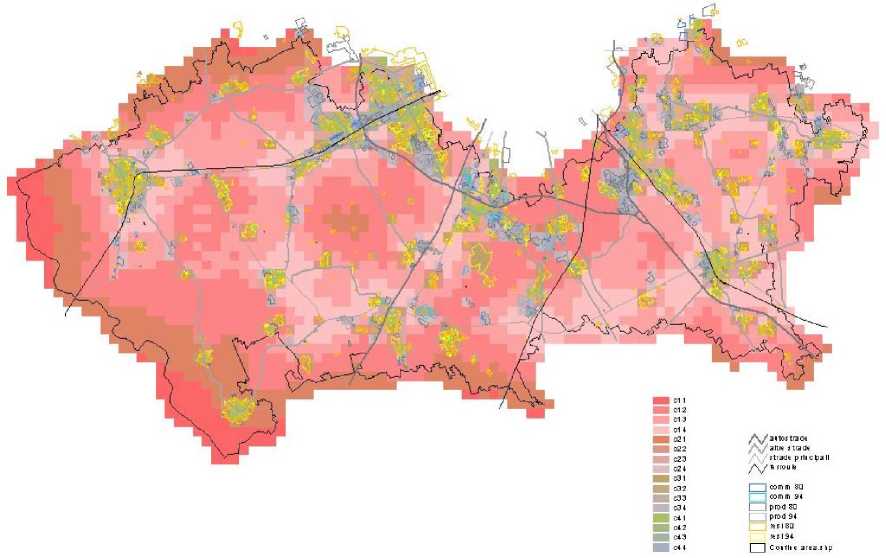
map (fig. 3) it is worthwhile to note that industrial settlements tend to aggregate
spatially, near or far from the urban centres, and road accessibility is not an essential
prerequisite for them.
In the fourth row the infilling processes in existing urban areas are represented: from the
residential growth in CL 4-1 and to the expansion near the existing industrial areas (CL
4-4); between the two groups CL 4-2 shows peripheral residential growth near industrial
areas and CL 4-3 classifies the emergence of new linear forms of urbanisation with land
use mix along the main roads. The spatial logic of commercial activities is shown in CL

Figure 3 - The spatial distribution of the SOM clusters
More intriguing information
1. The name is absent2. The name is absent
3. The name is absent
4. Migration and employment status during the turbulent nineties in Sweden
5. The name is absent
6. Non-farm businesses local economic integration level: the case of six Portuguese small and medium-sized Markettowns• - a sector approach
7. The name is absent
8. The name is absent
9. The name is absent
10. Integration, Regional Specialization and Growth Differentials in EU Acceding Countries: Evidence from Hungary