92
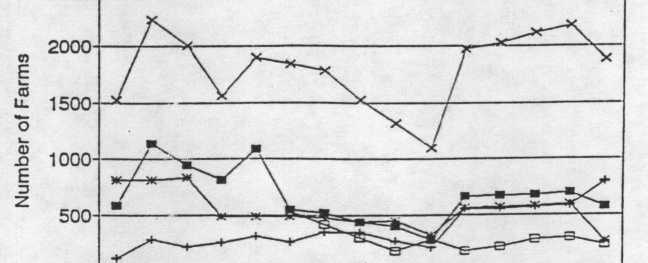
Figure 3.1: Number of total farms by province, 1976-1990
2500
1976 1978 1980 1982 1984 1986 1988 1990
1977 1979 1981 1983 1985 1987 1989
Year Ending
-0- Central -}- Copperbelt -- Southern
-e- Lusaka -- Total
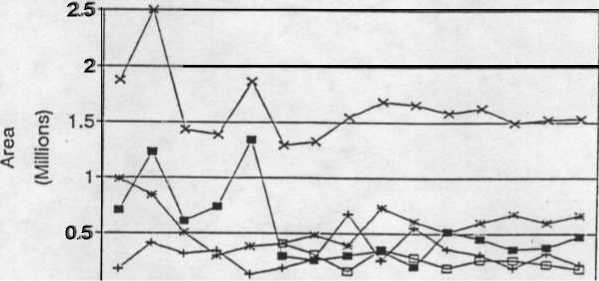
Figure 3.2: Area of total farms by province, 1976-1990
0 I ------------------------1---------------------
1976 1978 1980 1982 1984 1986 1988 1990
1977 1979 1981 1983 1985 1987 1989
Year Ending
|
-+- Central |
---Copperbelt - |
Southern |
|
-8-- Lusaka |
-'f- Total |
More intriguing information
1. Demand Potential for Goat Meat in Southern States: Empirical Evidence from a Multi-State Goat Meat Consumer Survey2. The name is absent
3. Globalization, Divergence and Stagnation
4. The Role of Evidence in Establishing Trust in Repositories
5. The name is absent
6. How do investors' expectations drive asset prices?
7. Searching Threshold Inflation for India
8. AMINO ACIDS SEQUENCE ANALYSIS ON COLLAGEN
9. The name is absent
10. The name is absent