93
Figure 3.3: Number of 0-79 ha farms by province, 1976-1988a
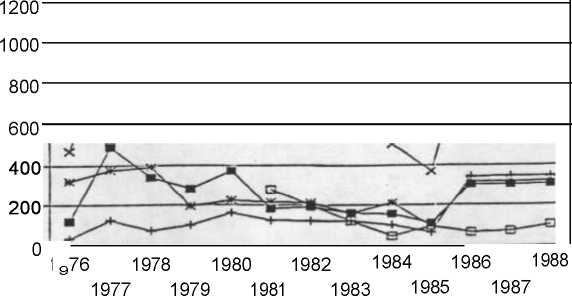
Year Ending
-0- Central --w- Copperbelt --- Southern
-8- Lusaka -u-- Total
a. Copperbelt province includes unlisted provinces.
Figure 3.4: Area of 0-79 ha farms by province, 1976-1988
Year Ending
- a-- Central -+- Copperbelt --w- Southern
~- Lusaka -w- Total
More intriguing information
1. Enterpreneurship and problems of specialists training in Ukraine2. The name is absent
3. The name is absent
4. The Veblen-Gerschenkron Effect of FDI in Mezzogiorno and East Germany
5. Three Strikes and You.re Out: Reply to Cooper and Willis
6. The name is absent
7. The name is absent
8. ROBUST CLASSIFICATION WITH CONTEXT-SENSITIVE FEATURES
9. Regulation of the Electricity Industry in Bolivia: Its Impact on Access to the Poor, Prices and Quality
10. A Note on Productivity Change in European Co-operative Banks: The Luenberger Indicator Approach