5
4
3
2
1
0
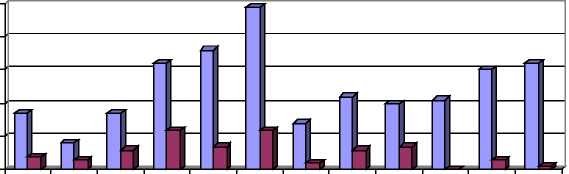
1993 1994 1995 1996 1997 1998 1999 2000 2001 2002 2003 2004
□ Total □ Food industry
Figure 3. Value of the foreign capital invested in the food, beverage and tobacco industry
against a background of the total investment in the production activity
Source: Data of the Polish Information and Foreign Investment Agency, 2006.
The situation as regards the share of the food industry in production
investments was diversified. In the initial period it was the main consumer of resources.
Its share amounted to as much as 37.5% in 1994 and 1996. It was understandable on
account of the interest of foreign investors first of all in those branches of industry
which could bring in fast and certain profits. In the next years the significance of
investing in the food industry decreased. It resulted, on the one hand, from he fact that
most companies from this industry were sold by the Polish government because they
were offered for privatisation in the first place and, on the other hand, the interest in
investing in industry other than food industry, automotive, chemical, electric industry
etc. grew.
3. Trends in investing in the agricultural and food industry
Foreign direct investments in Poland related to the production of foodstuffs,
alcoholic and non- alcoholic beverages and tobacco goods as of 31.12.2000. constituted
about 10% of all FDI's [Report 2001]. Main trends in foreign investments, their value and
share in particular branches of industry in 2002 were presented in table 2.
Table 2. Foreign investments in the main branches of agricultural and food production
(state as of 31.12.2002.)
|
Investment trend |
Number of |
Value of |
Investment |
|
Production of tobacco goods_____ |
5 |
1768______ |
25.7 |
|
Production of sweets and snacks |
23 |
1288______ |
_________18.7_________ |
|
Production of beer and malt______ |
13 |
1038______ |
_________15.1_________ |
|
Production of non- alcoholic beverages_______________________ |
5 |
555 |
8.0 |
|
Production of meat and |
12 |
483 |
70 |
|
Milk processing_________________ |
14 |
372 |
5.4 |
|
Production of fruit and vegetable |
11 |
318 |
4.6 |
|
Production of vegetable fats______ |
5 |
254 |
3.7 |
|
Sugar production________________ |
3 |
_______167_______ |
__________2.4__________ |
|
Fodder production_______________ |
4 |
_______160_______ |
__________2.3__________ |
|
Production of concentrates and |
10 |
162 |
2.3 |
|
Production of spirits______________ |
5 |
150 |
2.2 |
|
Grain processing_________________ |
8 |
________49________ |
__________0.7__________ |
|
Others___________________________ |
5 |
_______127_______ |
___________1.9___________ |
More intriguing information
1. The name is absent2. Strategic Investment and Market Integration
3. Pupils’ attitudes towards art teaching in primary school: an evaluation tool
4. Models of Cognition: Neurological possibility does not indicate neurological plausibility.
5. A COMPARATIVE STUDY OF ALTERNATIVE ECONOMETRIC PACKAGES: AN APPLICATION TO ITALIAN DEPOSIT INTEREST RATES
6. The Prohibition of the Proposed Springer-ProSiebenSat.1-Merger: How much Economics in German Merger Control?
7. Moffett and rhetoric
8. Direct observations of the kinetics of migrating T-cells suggest active retention by endothelial cells with continual bidirectional migration
9. The name is absent
10. The name is absent