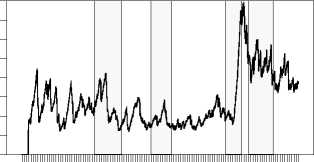
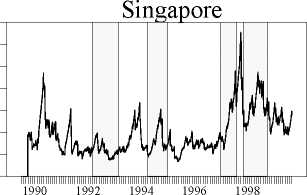
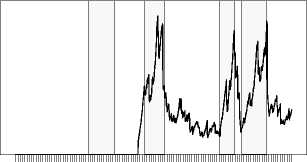
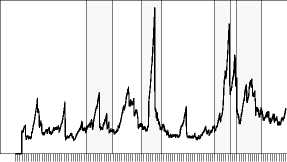
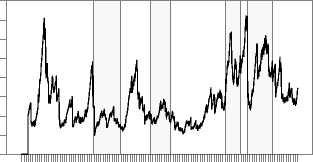
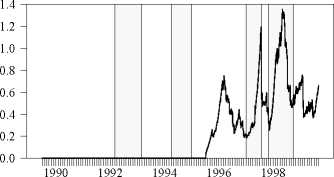
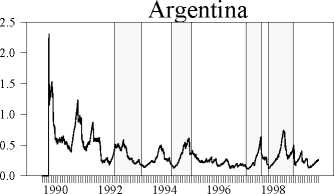
Fig. la - Stock market volatility (daily returns, 3M exp. mov. average)
0.8
0.7
0.6
0.5
0.4
0.3
0.2
0.1
0.0
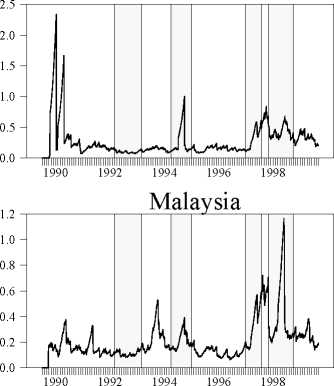
Korea
0.56
0.48
0.40
0.32
0.24
0.16
0.08
0.00
1990 1992 1994 1996 1998
0.8
0.7
0.6
0.5
0.4
0.3
0.2
0.1
0.0
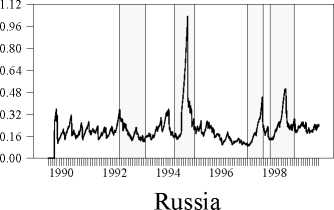
Brazil
1990 1992 1994 1996 1998
Hong Kong
1.00
0.75
0.50
0.25
0.00
1990 1992 1994 1996 1998
0.8
0.7
0.6
0.5
0.4
0.3
0.2
0.1
0.0
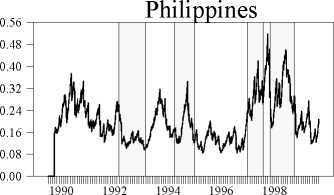
Thailand
1990 1992 1994 1996 1998
Indonesia
Mexico
More intriguing information
1. Non-causality in Bivariate Binary Panel Data2. La mobilité de la main-d'œuvre en Europe : le rôle des caractéristiques individuelles et de l'hétérogénéité entre pays
3. Using Surveys Effectively: What are Impact Surveys?
4. Prizes and Patents: Using Market Signals to Provide Incentives for Innovations
5. The name is absent
6. AN ANALYTICAL METHOD TO CALCULATE THE ERGODIC AND DIFFERENCE MATRICES OF THE DISCOUNTED MARKOV DECISION PROCESSES
7. The Structure Performance Hypothesis and The Efficient Structure Performance Hypothesis-Revisited: The Case of Agribusiness Commodity and Food Products Truck Carriers in the South
8. Monetary Policy News and Exchange Rate Responses: Do Only Surprises Matter?
9. Graphical Data Representation in Bankruptcy Analysis
10. Optimal Taxation of Capital Income in Models with Endogenous Fertility