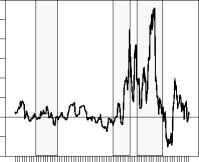
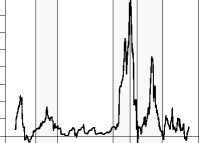
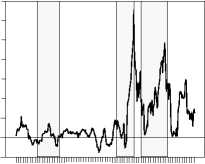
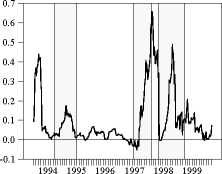
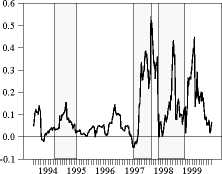
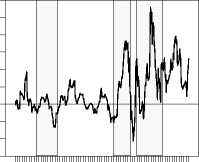
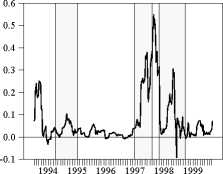
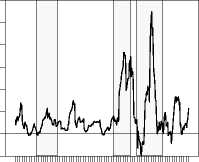
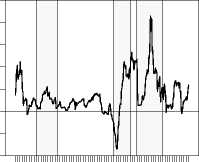
Fig. 2a - Stock market covariance of weekly returns
(Asia; 3 month exp. moving average)
Korea
Malaysia
Indonesia
Thailand
Malaysia
Indonesia
Thailand
Philippines
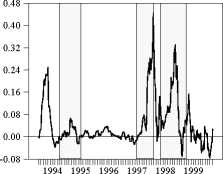
0.48
0.40
0.32
0.24
0.16
0.08
0.00
-0.08
-0.16
1994 1995 1996 1997 1998 1999
0.64
0.56
0.48
0.40
0.32
0.24
0.16
0.08
0.00
-0.08
1994 1995 1996 1997 1998 1999
0.7
0.6 -
0.5 -
0.4 -
0.3 -
0.2 -
0.1 -
0.0
-0.1
Iiiiiiiiiiiiiiiiiiiii
1994 1995 1996 1997 1998 1999
0.30
0.25
0.20
0.15
0.10
0.05
0.00
-0.05
-0.10
-0.15
1994 1995 1996 1997 1998 1999
0.48
0.40
0.32
0.24
0.16
0.08
0.00
-0.08
1994 1995 1996 1997 1998 1999
0.60
0.48
0.36
0.24
0.12
0.00
-0.12
-0.24
1994 1995 1996 1997 1998 1999
More intriguing information
1. Sectoral specialisation in the EU a macroeconomic perspective2. Publication of Foreign Exchange Statistics by the Central Bank of Chile
3. Volunteering and the Strategic Value of Ignorance
4. The name is absent
5. The effect of classroom diversity on tolerance and participation in England, Sweden and Germany
6. The name is absent
7. The name is absent
8. Private tutoring at transition points in the English education system: its nature, extent and purpose
9. The name is absent
10. The name is absent