H1. In effect, the H1 household avoids tax on a second income by having one parent
working in untaxed home production rather than in taxed market work.11
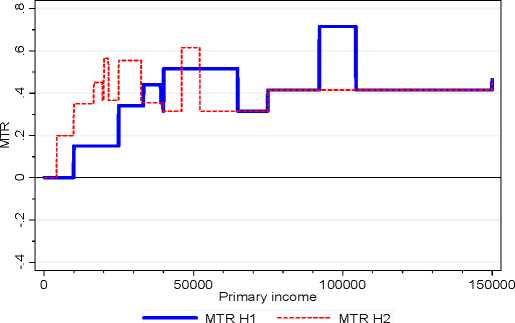
Figures 2a and 2b show what happens when the ML and FTBs are included. The
MTR and ATR profiles change dramatically. There is now a large gap between the
MTR profiles for H1 and H2, created by higher marginal rates on the second income
up to the point where the base rate of FTB-A has been entirely withdrawn on joint
income. In Figure 2b the resulting ATR on the income of the second earner, ATR2, is
well above that on the income of the primary earner, and therefore on the income of
the single-earner household, ATRH H1, up to around the upper income limit of
$104,317 for the base rate of FTB-A, for H1. As a result the ATR profile for the two-
earner household, ATRH H2, is well above that for the single-earner household,
ATRH H1, up to this point.
A gap of this kind between primary and second earner ATR profiles is a characteristic
feature of joint taxation. Under a system of full joint taxation or, equivalently, income
splitting, the second earner faces on the first dollar earned the MTR on the primary
earner’s last dollar. And because she faces a higher MTR on every dollar she earns,
she has a higher ATR. The withdrawal of FTBs on joint income and the income of
the second earner has the same effect up to the primary income level at which the H1
household has entirely lost FTB-A.
Figure 2a MTR schedule + LITO + ML + FTBs

11 If tax revenue is used to finance a universal benefit for each family, then, at any give level of primary
income, the H2 household contributes more to the revenue cost of the benefit and therefore effectively
finances a subsidy for the H1 household by working longer hours in the market.
More intriguing information
1. Conditions for learning: partnerships for engaging secondary pupils with contemporary art.2. Proceedings of the Fourth International Workshop on Epigenetic Robotics
3. The name is absent
4. The Mathematical Components of Engineering
5. The name is absent
6. The name is absent
7. Activation of s28-dependent transcription in Escherichia coli by the cyclic AMP receptor protein requires an unusual promoter organization
8. Stillbirth in a Tertiary Care Referral Hospital in North Bengal - A Review of Causes, Risk Factors and Prevention Strategies
9. Developments and Development Directions of Electronic Trade Platforms in US and European Agri-Food Markets: Impact on Sector Organization
10. Special and Differential Treatment in the WTO Agricultural Negotiations