Figure 6b: Health insurance fees
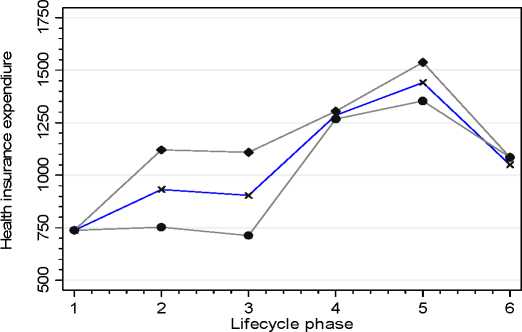
All h H1
H2
The H2 household also typically spends more on health overall, as we would expect,
given the preceding results. Figure 7 plots the lifecycle profiles of median household
expenditure on medical care and health expenses. The profiles tend to match those for
female labour supply up to the pre-retirement phase, where the medians for both
household groups tend to converge.
Figure 7: Household health costs
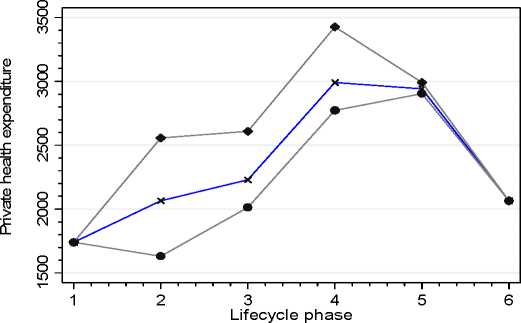
All ∙ H1
H2
19
More intriguing information
1. Economic Evaluation of Positron Emission Tomography (PET) in Non Small Cell Lung Cancer (NSCLC), CHERE Working Paper 2007/62. Popular Conceptions of Nationhood in Old and New European
3. Nietzsche, immortality, singularity and eternal recurrence1
4. The technological mediation of mathematics and its learning
5. Une Gestion des ressources humaines à l'interface des organisations : vers une GRH territoriale ?
6. The name is absent
7. The name is absent
8. 09-01 "Resources, Rules and International Political Economy: The Politics of Development in the WTO"
9. The name is absent
10. Synchronisation and Differentiation: Two Stages of Coordinative Structure