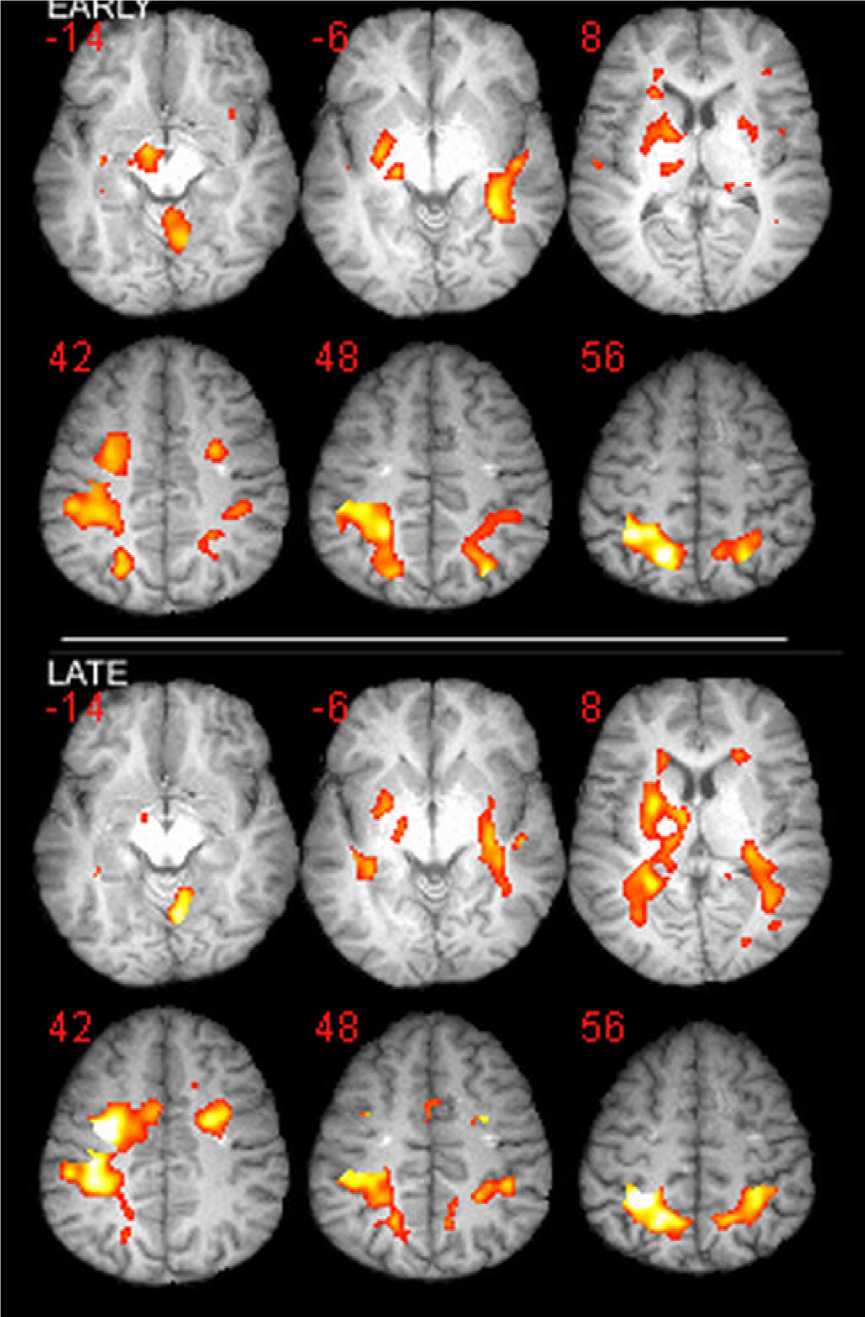
Figure 4. Brain activation in the visual setting. Slice overlays depicting some of the
subcortical and cortical activations found in the visual setting compared to the follow.
Color scale indicates T values of activation thresholded at p<.005 ranging from 0 to 7.
Activations are overlaid on one of the subjects’ skull-stripped normalized structural
MRI. Top panel shows activations in early stage and bottom panel shows activations
in late stage. The slices are selected to represent activations in the right anterior
cerebellum (z=-14 mm), ventral striatum (z= -6 mm) and dorsal putamen(z=8 mm) in
the top row and Inferior Parietal (z= 42), dorsal premotor cortex (z=42), Pre-
SMA(z=48) and Superior Parietal cortex(z=56) in the bottom row.
12
More intriguing information
1. The name is absent2. Macroeconomic Interdependence in a Two-Country DSGE Model under Diverging Interest-Rate Rules
3. Industrial Cores and Peripheries in Brazil
4. The name is absent
5. Concerns for Equity and the Optimal Co-Payments for Publicly Provided Health Care
6. The name is absent
7. THE CHANGING RELATIONSHIP BETWEEN FEDERAL, STATE AND LOCAL GOVERNMENTS
8. Happiness in Eastern Europe
9. Institutions, Social Norms, and Bargaining Power: An Analysis of Individual Leisure Time in Couple Households
10. PROJECTED COSTS FOR SELECTED LOUISIANA VEGETABLE CROPS - 1997 SEASON