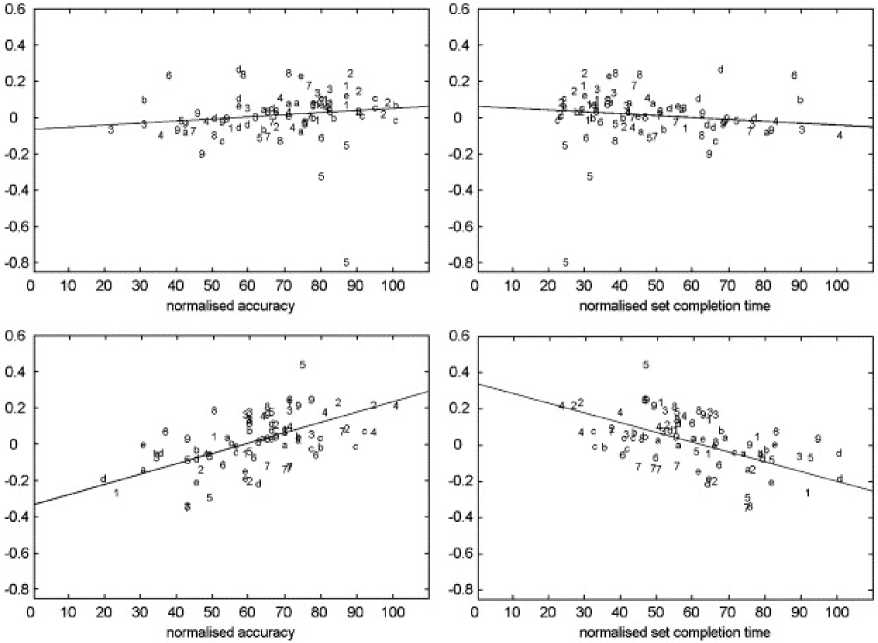
Figure 6. Brain-behavior correlation at Pre-SMA. Voxel data were extracted from a 3
mm spherical VOI defined at Pre-SMA (Talairach coordinates x=-4, y=8, z=46 mm;
Table 3b) and the average BOLD signal for each of the six sessions was calculated for
each subject separately for motor and visual experiments. Average performance
measures were calculated for the six sessions for each subject separately for the two
experiments. Graph depicts the scatter plot between the normalized behavioral
measure (accuracy: left panel and set completion time: right panel) and the BOLD
signal for each subject (1 - 9 and a - e). The regression line fits the average values of
behavioral measure and the BOLD signal. The top panel shows the results for motor
setting and the bottom panel for the visual setting. The correlation results are: Motor
[Accuracy: R = 0.39, p=0.44; Time: R = -0.38, p=0.46]; Visual [Accuracy: R = 0.99,
p<.0001; Time: R = -0.99, p<.0001]. Clearly, the activity in pre-SMA is closely
related to performance improvements in the visual setting but not the motor setting.
19
More intriguing information
1. Improving behaviour classification consistency: a technique from biological taxonomy2. The name is absent
3. The name is absent
4. Self-Help Groups and Income Generation in the Informal Settlements of Nairobi
5. The name is absent
6. Fiscal Policy Rules in Practice
7. Improving Business Cycle Forecasts’ Accuracy - What Can We Learn from Past Errors?
8. Contribution of Economics to Design of Sustainable Cattle Breeding Programs in Eastern Africa: A Choice Experiment Approach
9. The name is absent
10. The name is absent