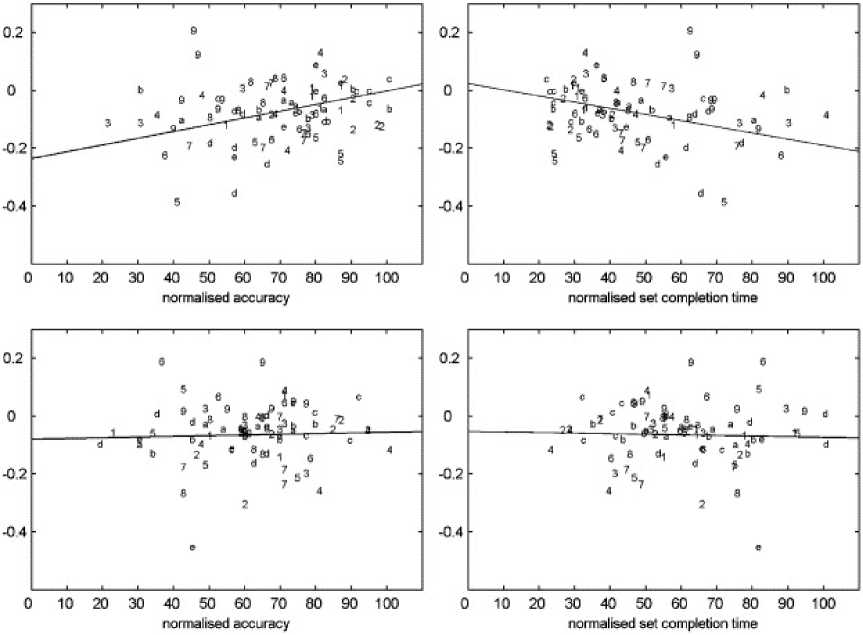
Figure 7. Brain-behavior correlation at SMA. The correlation analysis procedure is
described in the caption for Figure 6. Voxel data were extracted from a VOI defined
at SMA (Talairach coordinates x=-6, y=-17, z=49 mm; Table 4a). The top panel
shows the results for motor setting and the bottom panel for the visual setting. The
correlation results are: Motor [Accuracy: R = 0.87, p<.05; Time: R = -0.86, p<.05];
Visual [Accuracy: R = 0.18, p=0.73; Time: R = -0.16, p=0.75]. Clearly, the activity in
SMA is closely related to performance improvements in the motor setting but not the
visual setting.
20
More intriguing information
1. Monopolistic Pricing in the Banking Industry: a Dynamic Model2. Inflation and Inflation Uncertainty in the Euro Area
3. Cultural Diversity and Human Rights: a propos of a minority educational reform
4. A Dynamic Model of Conflict and Cooperation
5. Creating a 2000 IES-LFS Database in Stata
6. The name is absent
7. The growing importance of risk in financial regulation
8. NEW DEVELOPMENTS IN FARM PRICE AND INCOME POLICY PROGRAMS: PART I. SITUATION AND PROBLEM
9. The name is absent
10. SOME ISSUES CONCERNING SPECIFICATION AND INTERPRETATION OF OUTDOOR RECREATION DEMAND MODELS