CHAPTER 5. SIMULATION RESULTS
50
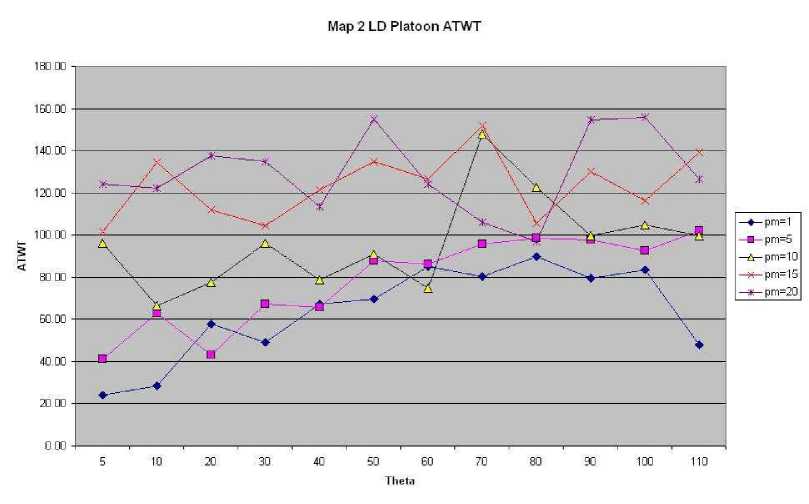
Figure 5.22: Map2- low density - Platoon control - ATWT
Low traffic density For φmin = 1or5 and θ = 5, the ATWT has the lowest
value. The ATWT has a value of 24.18 for φmin = 1, and 41.07 for φmin = 5.
The corresponding TWQL are respectively 0 and 421.
5.2.6 Summary
|
controller |
density |
ATWT |
TWQL |
|
marching |
HD |
304 |
2346 |
|
optim |
HD |
406 |
2467 |
|
request |
HD |
234 |
1294 |
|
phase |
HD |
242 |
1164 |
|
platoon |
HD |
x |
x |
|
marching |
LD |
282 |
1128 |
|
optim |
LD |
332 |
1040 |
|
request |
LD |
45 |
6 |
|
phase |
LD |
116 |
101 |
|
platoon |
LD |
24 |
0 |
Table 5.4: Scenario 2: Best results
More intriguing information
1. DISCUSSION: ASSESSING STRUCTURAL CHANGE IN THE DEMAND FOR FOOD COMMODITIES2. The name is absent
3. WP 48 - Population ageing in the Netherlands: Demographic and financial arguments for a balanced approach
4. Menarchial Age of Secondary School Girls in Urban and Rural Areas of Rivers State, Nigeria
5. An Attempt to 2
6. The Impact of Individual Investment Behavior for Retirement Welfare: Evidence from the United States and Germany
7. The name is absent
8. Developmental Robots - A New Paradigm
9. A Brief Introduction to the Guidance Theory of Representation
10. AN ANALYTICAL METHOD TO CALCULATE THE ERGODIC AND DIFFERENCE MATRICES OF THE DISCOUNTED MARKOV DECISION PROCESSES