CHAPTER 5. SIMULATION RESULTS
49
5.2.5 Sotl-platoon controller
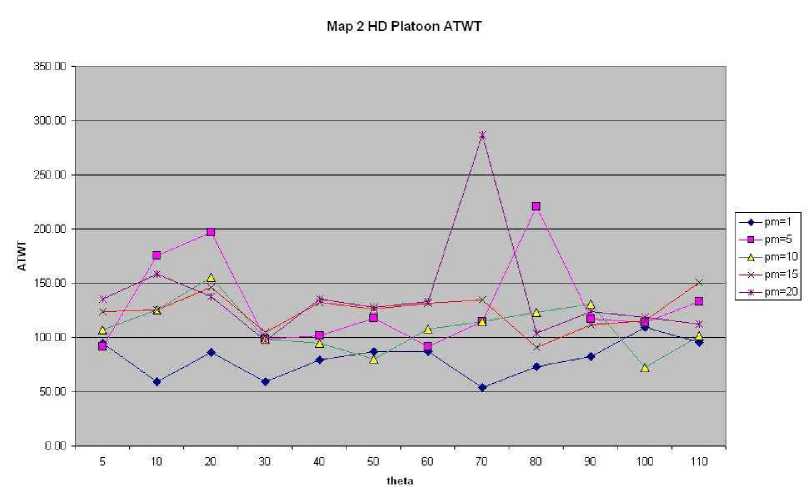
Figure 5.21: Map2- high density - Platoon control - ATWT
High traffic density Figure 5.21 shows that the ATWT value is not as pre-
dictable for platoon controller as for sotl-phase. For φmin = 1 and θ = 70, the
graph shows the best results with the lowest ATWT value of 54.17 and a TWQL
of 5484. For φmin = 10 and θ = 100, the lowest ATWT value is 72.29 with
TWQL of 5241. These are very high values for TWQL. This implies that the cal-
culated values for ATWT are not satisfactory to represent the real ATWT of all
road users. The ATWT values are calculated for the road users that arrive at their
destination. Because most of the road users do not reach their destination, those
road users will not be taken into account.
In the beginning of the simulation, everything works as expected, but the roads
get filled up. When all main stream lanes are full, the system gets blocked. Traffic
light configurations stay the same, because the conditions ofa platoon is crossing
are satisfied. This can happen when a few longer vehicles are waiting before a
green light and cannot move because the next road is full.
More intriguing information
1. The name is absent2. Long-Term Capital Movements
3. A Note on Productivity Change in European Co-operative Banks: The Luenberger Indicator Approach
4. WP 92 - An overview of women's work and employment in Azerbaijan
5. Better policy analysis with better data. Constructing a Social Accounting Matrix from the European System of National Accounts.
6. PER UNIT COSTS TO OWN AND OPERATE FARM MACHINERY
7. he Effect of Phosphorylation on the Electron Capture Dissociation of Peptide Ions
8. Enterpreneurship and problems of specialists training in Ukraine
9. Orientation discrimination in WS 2
10. Modelling the Effects of Public Support to Small Firms in the UK - Paradise Gained?