CHAPTER 5. SIMULATION RESULTS
52
5.3 Scenario 3: Wetstraat
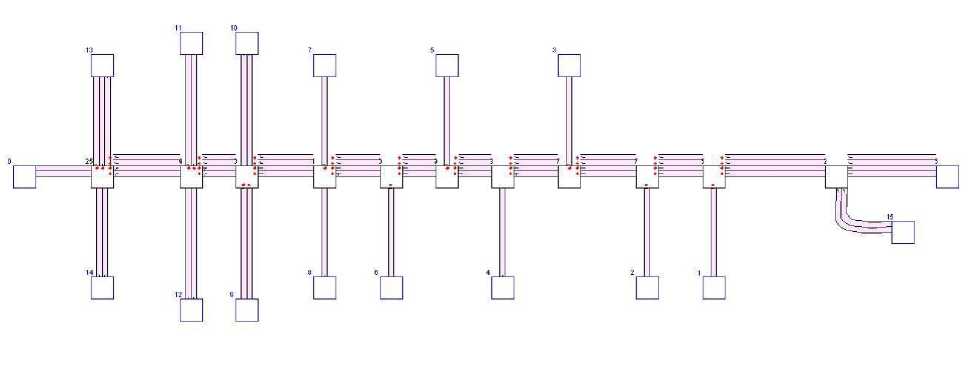
Figure 5.23: Map3 - Wetstraat
The simulations for the Wetstraat will be done for different traffic densities during
the day. Those traffic densities are represented in table 5.5. The values in this
table are the vehicle counts at the beginning of the Wetstraat. Theses counts are
done by Ministry of the Brussels-Capital region. The spawn frequencies will be
calculated based on those counts.
|
0 |
1 |
2 |
3 |
4 |
5 |
6 |
7 |
8 |
9 |
10 |
11 | |
|
476 |
255 |
145 |
120 |
175 |
598 |
2933 |
5270 |
4141 |
4028 |
3543 |
3353 | |
|
12 |
13 |
14 |
15 |
16 |
17 |
18 |
19 |
20 |
21 |
22 |
23 | |
|
3118 |
3829 3828 3334 |
3318 |
3519 |
3581 |
3734 |
2387 |
1690 |
1419 |
1083 | |||
Table 5.5: Vehicle count of Wetstraat
Carlos Gershenson and I made a field trip to the Wetstraat to get an idea of the
destination frequencies of the Wetstraat. We counted the cars from the Wetstraat
turning into crossing streets, and cars entering the Wetstraat from the crossing
streets. At the intersection of the Wetstraat and the Kunstlaan we used a camera
to help counting the cars.
For the intersection of Wetstraat with Trierstraat
More intriguing information
1. MICROWORLDS BASED ON LINEAR EQUATION SYSTEMS: A NEW APPROACH TO COMPLEX PROBLEM SOLVING AND EXPERIMENTAL RESULTS2. Global Excess Liquidity and House Prices - A VAR Analysis for OECD Countries
3. Financial Development and Sectoral Output Growth in 19th Century Germany
4. Pupils’ attitudes towards art teaching in primary school: an evaluation tool
5. The changing face of Chicago: demographic trends in the 1990s
6. Effort and Performance in Public-Policy Contests
7. A Classical Probabilistic Computer Model of Consciousness
8. The name is absent
9. Pass-through of external shocks along the pricing chain: A panel estimation approach for the euro area
10. Campanile Orchestra