CHAPTER 5. SIMULATION RESULTS
67
Wetstraat platoon controller: relation between density and theta
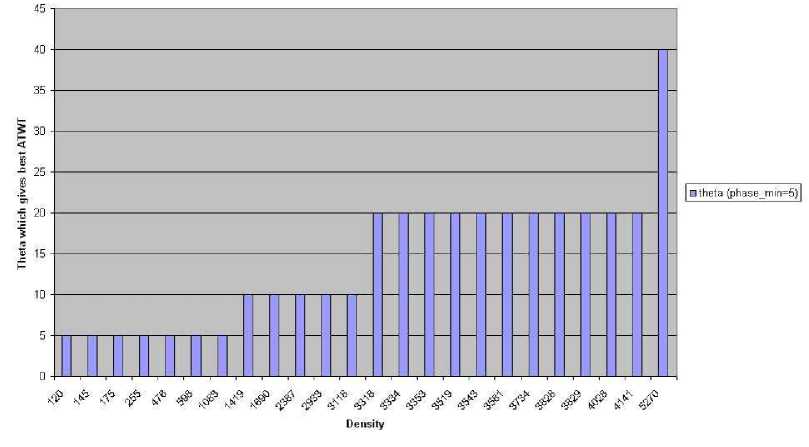
Figure 5.29: This graph shows the best values of θ in function of the density in
the Wetstraat with φmin set to 5. Platoon controller is used.
The graph for φmin = 5 shows us that a higher traffic density needs a higher θ.
With a higher phases_min value, the graph will grow more.
The sensors of a sotl-method could be used to decide in real time which θ to
use and it seems that φmin = 5 does not need to be changed.
More intriguing information
1. The name is absent2. Uncertain Productivity Growth and the Choice between FDI and Export
3. Perceived Market Risks and Strategic Risk Management of Food Manufactures: Empirical Results from the German Brewing Industry
4. Financial Market Volatility and Primary Placements
5. Estimating the Technology of Cognitive and Noncognitive Skill Formation
6. Natural hazard mitigation in Southern California
7. ISO 9000 -- A MARKETING TOOL FOR U.S. AGRIBUSINESS
8. A Regional Core, Adjacent, Periphery Model for National Economic Geography Analysis
9. Government spending composition, technical change and wage inequality
10. Wettbewerbs- und Industriepolitik - EU-Integration als Dritter Weg?