32
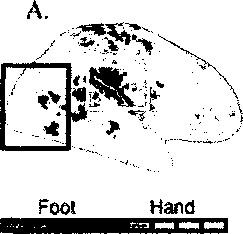
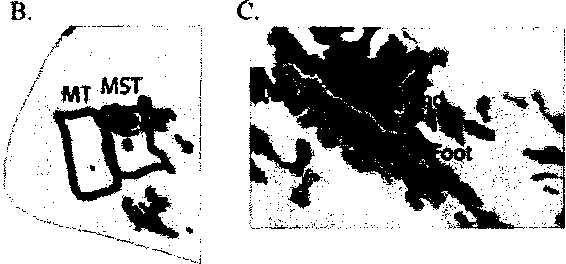
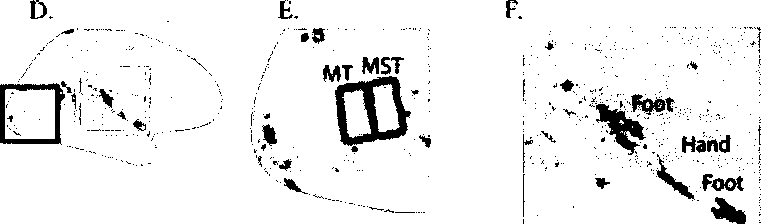
Figure 4. Location of hand- and foot-preferring regions (A-С, single subject; D-F, group data). A,
Lateral view of right hemisphere. The color scale shows regions with a significant response to tactile
stimulation and a preference for contralateral (left) foot stimulation (blue color scale), contralateral
(left) hand stimulation (orange color scale), or no preference (green). The same color scale is used
for A-F. B, Enlarged view of posterior lateral cortex (black region outlined in A). C, Enlarged view of
operculum (white region outlined in A). Amirror-Symmetricorganization of foot- and hand-
responsive areas was observed. D, Lateral view of group average dataset. E, Enlarged view of
posterior cortex. F, Enlarged view of operculum.
Our analyses were conducted without any spatial smoothing to prevent the
Possibilitythat smoothing would blur activity from our visual areas of interest (MT, MST,
and LOC), all of which are in close proximity. However, to obtain a global picture of brain
areas responsive to Vibrotactile stimulation, we performed a traditional SPM-StyIe
analysis in which a coarse (8 mm) Gaussian filter was applied to each individual subjects
data before intersubject averaging. Then, a clustering technique was used to find the
largest areas of activation on the group average cortical surface map. The results of this
analysis are shown in Figure 5 and Table 1. As expected, the spatial smoothing blurred
More intriguing information
1. The name is absent2. Temporary Work in Turbulent Times: The Swedish Experience
3. Place of Work and Place of Residence: Informal Hiring Networks and Labor Market Outcomes
4. The name is absent
5. The name is absent
6. The name is absent
7. GROWTH, UNEMPLOYMENT AND THE WAGE SETTING PROCESS.
8. WP 36 - Women's Preferences or Delineated Policies? The development or part-time work in the Netherlands, Germany and the United Kingdom
9. National curriculum assessment: how to make it better
10. Using Surveys Effectively: What are Impact Surveys?