35


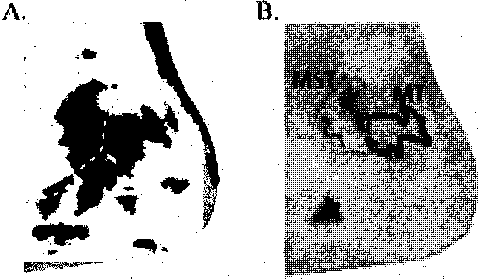
Figuree1ABrainareasresponsivetovisualmotionthatshowedaresponsetoipsiIateraIvisuaI
stimulation (MST; blue) or no response to ipsilateral stimulation (MT; green) in a control subject
(enlarged view of posterior left hemisphere). B, Composite map showing location of area MST and
MTin the same subject overlaid on tactile activation map for an experiment in which all stimuli
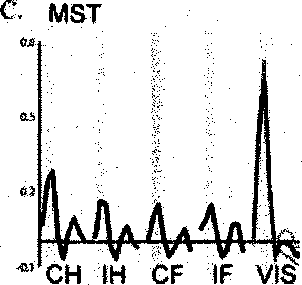
were delivered to the contralateral (right) hand. C, Results of a separate control experiment
Comparingresponsestosomatosensoryandvisualstimulation-Shownisanaveragetimeseries
from MST in a single subject for contralateral hand and ipsilateral hand (CH and IH, respectively) and
foot (CF and IF, respectively) stimulation and for an average of six types of visual stimulation
Consistingofmovingpoint-Iightfigures(VIS).
Postmortem human brain studies have identified multiple Cytoarchitectonically ,
defined areas in the neighborhood of Sl and S2 (Eickhoff, et al. 2006a; Eickhoff, et al.
2007; Eickhoff, et al. 2006b; Geyer, et al. 1999; Grefkes, et al. 2001), To determine
which ofthese areas were active in our study, we created an intersubject volume
average and Overlaid it on the publicly available standard-space map of
cytoarchitectonie areas (Fig. 7). Near the superior portion of the central sulcus, activity
was observed in areas 1,2, and 3b, areas collectively referred to as the primary
somatosensory cortex or SI. In the parietal operculum, activity was observed in OPl
(possible homolog of area Sll), 0P2 (possible homolog of PIVC), 0P3 (possible homolog
of area VS) and 0P4 (possible homolog of area PV). To obtain a quantitative measure of
which opercular areas were most active, we calculated the fraction of voxels within each
region that exceeded our significance threshold of p < 0.01. A majority of voxels in OPl
More intriguing information
1. Before and After the Hartz Reforms: The Performance of Active Labour Market Policy in Germany2. A Hybrid Neural Network and Virtual Reality System for Spatial Language Processing
3. Stillbirth in a Tertiary Care Referral Hospital in North Bengal - A Review of Causes, Risk Factors and Prevention Strategies
4. Understanding the (relative) fall and rise of construction wages
5. Comparative study of hatching rates of African catfish (Clarias gariepinus Burchell 1822) eggs on different substrates
6. The name is absent
7. Wirkung einer Feiertagsbereinigung des Länderfinanzausgleichs: eine empirische Analyse des deutschen Finanzausgleichs
8. The name is absent
9. WP 92 - An overview of women's work and employment in Azerbaijan
10. RETAIL SALES: DO THEY MEAN REDUCED EXPENDITURES? GERMAN GROCERY EVIDENCE