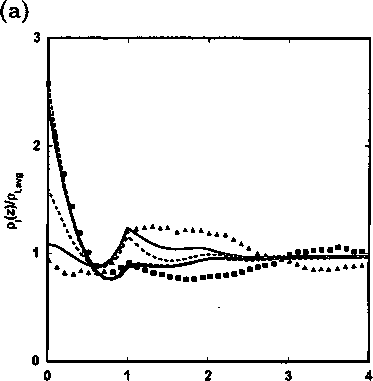
Figure 7.5: (a) Comparison of the average end- (■) and mid-segments (à) density profiles
of the confined 21-segment linear (dashed curves) and 4-arm star (solid curves) polymer
fluids at ηaυg — 0.3. The black curves represent the end-segments while the gray curves
represent the mid-segments density profiles. Symbols are the molecular simulation results
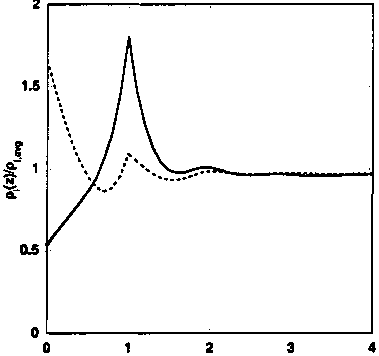
for the star polymer fluid from Yethiraj and Hall [265]. (b) Comparison of the articulation
segment (solid curve) and average arm segments (dashed curve) density profiles of the
confined 4-arm star (m = 5) polymer fluid.
(b)
z∕σ
the volumetric properties of the bulk athermal polymers are not very sensitive to the
details of molecular topology. The figure also compares the segment density profile
of the star polymer obtained from modified iSAFT with the molecular simulation
results from Yethiraj and Hall [265]. As shown in the figure, modified iSAFT is in
excellent agreement with the simulation data.
Although the total segment density profile of the confined star and linear polymer
fluids are similar, the distribution of the individual segments are quite different. For
example, fig. 7.5a compares the average density profiles of the end- and the mid-
segments of the star and linear polymers. Here, the mid-segments of the star polymer
200
More intriguing information
1. BEN CHOI & YANBING CHEN2. The name is absent
3. Expectations, money, and the forecasting of inflation
4. The name is absent
5. Migration and employment status during the turbulent nineties in Sweden
6. Macroeconomic Interdependence in a Two-Country DSGE Model under Diverging Interest-Rate Rules
7. The name is absent
8. Volunteering and the Strategic Value of Ignorance
9. The name is absent
10. Effects of a Sport Education Intervention on Students’ Motivational Responses in Physical Education