40
Soma Voltage Errors (Quasi-active vs. ВТ)
10∣-----------------------------------,------------------------
О 10 20 30 40 50
Time (ms)
Comparison of Computed Soma Voltages
Soma Voltage Errors with Tonic Synapses (Quasi-active vs. BT)
0.8
ω -0.4
0 10 20 30 40 50
Time (ms)
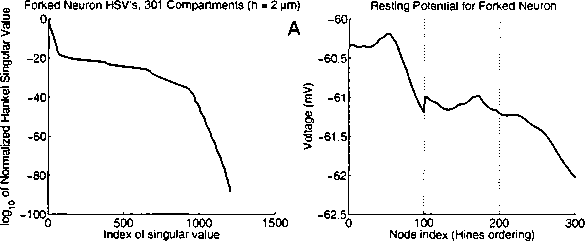
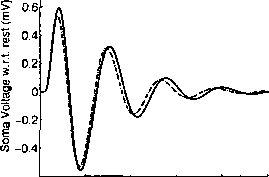
Figure 2.7: A) Hankel singular values for the forked neuron given a 2 μm compartment size. Since
there are 301 compartments and the HH ion channels have 3 gating variables, the quasi-active system
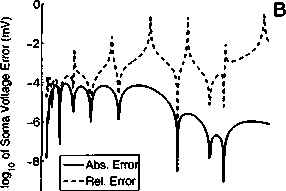
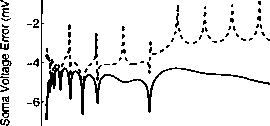
has 1204 variables; hence the BT system has the same number of HSVs. B) Absolute and relative
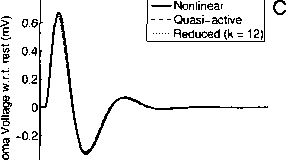
errors between the computed soma potentials of the quasi-active and BT systems. C) Computed
soma potentials from the nonlinear, quasi-active, and BT simulations. At the 1 ms mark a 1 nS
alpha-function synaptic input with time constant τ = 1 ms was applied to the midpoint of the
top distal branch. Notice that the quasi-active and BT curves are indistinguishable. D) Resting
potential of each node for the forked neuron with 10% tonic synapses of gbs = 0.2 nS each. In the
absence of tonic synapses, each node is at rest at ≈ —64.9186 mV. The faint dotted line indicates
the end of a branch. E-F) Same as (B-C), but for the case of tonic synapses. Notice that tonic
synapses induce more oscillations for the exact same stimulus.
-10l-----------.-----------------------------------.------------
0 10 20 30 40 50
Time (ms)
Comparison of Computed Soma Voltages with Tonic Synapses
0.8r r-
0 10 20 30 40 50
Time (ms)
tonic components gbs = 0.2 nS, which changes the rest potential of the neuron from
a uniform value of ≈ —64.9186 mV to one that is now spatially-varying and elevated
(Figure 2.7D). Using the exact same stimulus as used for Figure 2.7B-C, we find that
More intriguing information
1. Permanent and Transitory Policy Shocks in an Empirical Macro Model with Asymmetric Information2. The Value of Cultural Heritage Sites in Armenia: Evidence From a Travel Cost Method Study
3. Human Rights Violations by the Executive: Complicity of the Judiciary in Cameroon?
4. Innovation in commercialization of pelagic fish: the example of "Srdela Snack" Franchise
5. THE MEXICAN HOG INDUSTRY: MOVING BEYOND 2003
6. Evidence on the Determinants of Foreign Direct Investment: The Case of Three European Regions
7. Word Sense Disambiguation by Web Mining for Word Co-occurrence Probabilities
8. Knowledge and Learning in Complex Urban Renewal Projects; Towards a Process Design
9. The name is absent
10. The name is absent