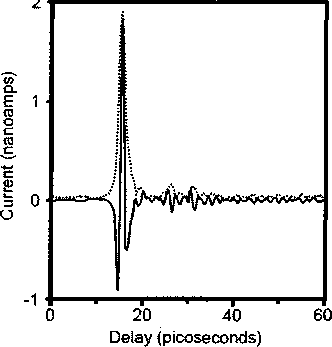
Figure 2.2 : (left) A typical time-domain terahertz waveform, measured in ambient air.
The oscillatory features which follow the initial single-cycle transient are the result
of water vapor in the beam path. The dotted curve shows the intensity envelope,
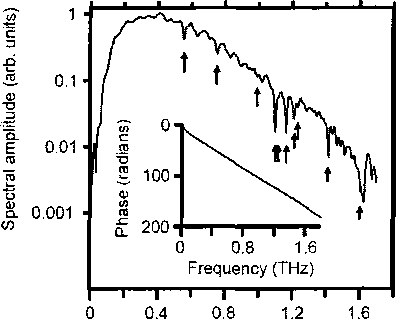
computed from the measured electric field E(t) using a Hilbert transform, (right) The
spectral amplitude ∣El(ω)∣ derived from the held shown at left by Fourier transform,
on a log scale. The vertical arrows indicate the spectral positions of tabulated water
vapor absorption lines. The inset shows the spectral phase, also derived from the
time-domain measurement. This is essentially linear, as expected for a single-cycle
pulse. The effects of the water vapor absorption lines on the phase are measurable,
but are too small to see in this display.
Frequency (Terahertz)
THz spectrometers.
Other useful aspects of the time-domain spectrometer are illustrated by Figure 2.2,
which shows a typical waveform and the corresponding spectral amplitude and phase.
The left panel shows the raw data from a photoconductive sampling measurement,
which is the photo-induced current in a terahertz substrate antenna as a function of
the delay between the terahertz pulse and the optical gate pulse. This is approxi-
mately proportional to the terahertz electric field E(F), which contains both amplitude
and phase (i.e., timing) information.
More intriguing information
1. sycnoιogιcaι spaces2. The name is absent
3. Towards a Mirror System for the Development of Socially-Mediated Skills
4. PEER-REVIEWED FINAL EDITED VERSION OF ARTICLE PRIOR TO PUBLICATION
5. Performance - Complexity Comparison of Receivers for a LTE MIMO–OFDM System
6. CREDIT SCORING, LOAN PRICING, AND FARM BUSINESS PERFORMANCE
7. Nach der Einführung von Arbeitslosengeld II: deutlich mehr Verlierer als Gewinner unter den Hilfeempfängern
8. The name is absent
9. The name is absent
10. Voting by Committees under Constraints