61
Time
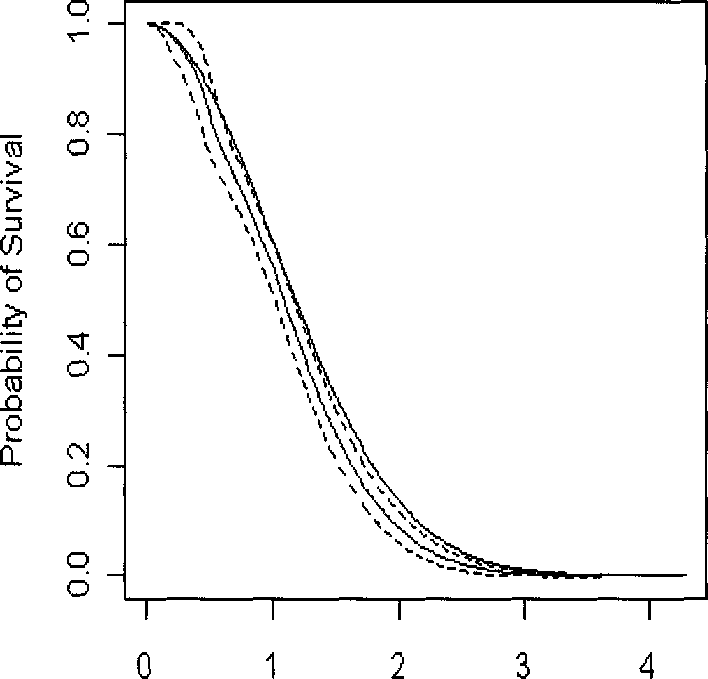
Figure 3.3: Survival Curves Obtained Using the Proposed Method From Test 2
Treat T: as the time of event; C: as the time of dependent censoring; S: as the time of
independent censoring. The true curve (in Red), the estimated curve obtained using
the proposed method (in Blue) and its Confidence Intervals (dashed lines).
More intriguing information
1. Review of “The Hesitant Hand: Taming Self-Interest in the History of Economic Ideas”2. An alternative way to model merit good arguments
3. Problems of operationalizing the concept of a cost-of-living index
4. Managing Human Resources in Higher Education: The Implications of a Diversifying Workforce
5. For Whom is MAI? A theoretical Perspective on Multilateral Agreements on Investments
6. Do the Largest Firms Grow the Fastest? The Case of U.S. Dairies
7. The name is absent
8. The value-added of primary schools: what is it really measuring?
9. The name is absent
10. The Context of Sense and Sensibility