62
Time
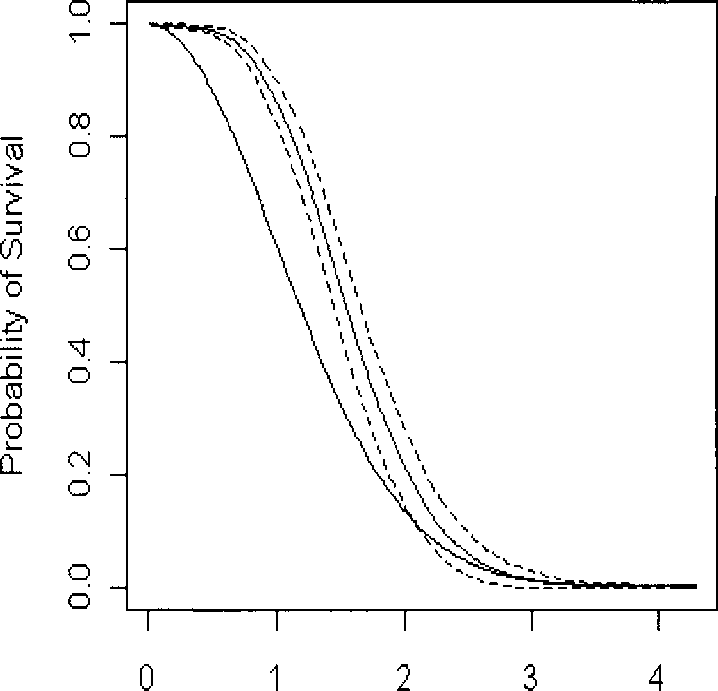
Figure 3.4: Survival Curves Obtained Using the Coxph Method From Test 2
Treat T: as the time of event; C: as the time of dependent censoring; S: as the time of
independent censoring. The true curve (in Red), the estimated curve obtained using
the Coxph method (in Blue) and its Confidence Intervals (dashed lines).
More intriguing information
1. The name is absent2. Developments and Development Directions of Electronic Trade Platforms in US and European Agri-Food Markets: Impact on Sector Organization
3. The name is absent
4. AN ECONOMIC EVALUATION OF COTTON AND PEANUT RESEARCH IN SOUTHEASTERN UNITED STATES
5. ISSUES IN NONMARKET VALUATION AND POLICY APPLICATION: A RETROSPECTIVE GLANCE
6. The name is absent
7. The name is absent
8. Dendritic Inhibition Enhances Neural Coding Properties
9. The name is absent
10. The name is absent