94
1.00
0.95
0.90
0.85
0.80
0.75
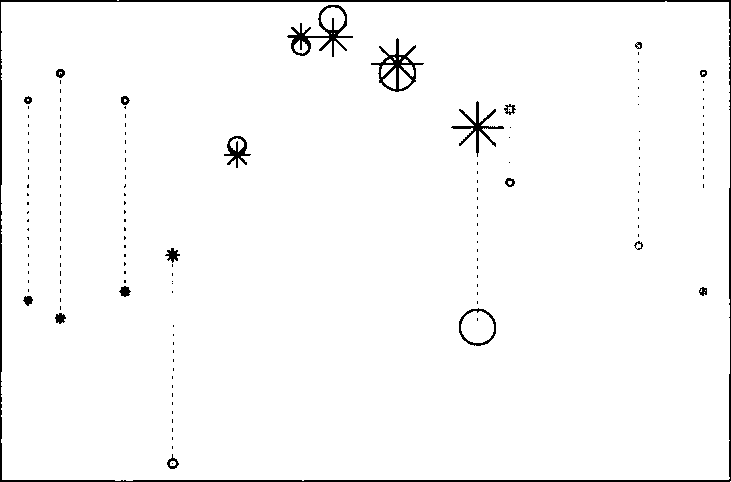

Simulation true success rates
Figure 4.2: Scenario SO. Coverage probabilities of the central 95% credible intervals
under the NEPPM with 7 = 1 vs. the HLRM. From left to right, the first three
success rates correspond to poor prognosis (τi = —1), the following six to intermediate
(xi = 0) and the last three to good prognosis (xi = 1). The character sizes are
proportional to the sample size N{.
More intriguing information
1. Regional Intergration and Migration: An Economic Geography Model with Hetergenous Labour Force2. THE EFFECT OF MARKETING COOPERATIVES ON COST-REDUCING PROCESS INNOVATION ACTIVITY
3. The name is absent
4. The name is absent
5. The name is absent
6. The name is absent
7. Improving Business Cycle Forecasts’ Accuracy - What Can We Learn from Past Errors?
8. The name is absent
9. An Interview with Thomas J. Sargent
10. Rent Dissipation in Chartered Recreational Fishing: Inside the Black Box