96
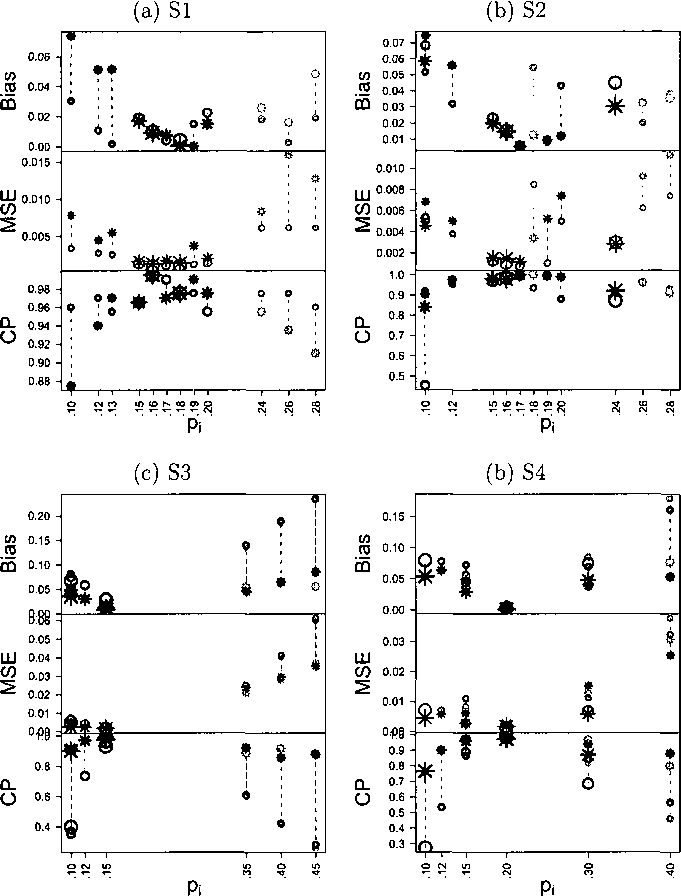
Figure 4.3: Scenarios Sl through S4. Panels (a) through (d) summarize simulation
under scenarios Sl through S4. Comparison of the estimated success rates under
the NEPPM (star “*”) vs. the HLRM (circle “o”). The horizontal axis shows the
n = 12 true success rates under the assumed scenario. The upper, medium and lower
panels show absolute value of the bias, mean square error and coverage probability of
the central 95% credible interval, respectively. All are arranged by subtype. Under
Sl (panel (a)), from left to right, the first three success rates correspond to poor
prognosis {xl — —1), the following six to intermediate (rrj = 0) and the last three to
good prognosis (xi = 1). The point sizes are proportional to the sample size Nl.
More intriguing information
1. Luce Irigaray and divine matter2. The name is absent
3. Smith and Rawls Share a Room
4. The name is absent
5. CGE modelling of the resources boom in Indonesia and Australia using TERM
6. Testing Hypotheses in an I(2) Model with Applications to the Persistent Long Swings in the Dmk/$ Rate
7. The Distribution of Income of Self-employed, Entrepreneurs and Professions as Revealed from Micro Income Tax Statistics in Germany
8. Death as a Fateful Moment? The Reflexive Individual and Scottish Funeral Practices
9. Economies of Size for Conventional Tillage and No-till Wheat Production
10. APPLICATIONS OF DUALITY THEORY TO AGRICULTURE