93
0.12
0.10
0.08
ω
го
СО 0.06
0.04
0.02
0.00
0.035
0.030
0.025
φ0.020
0.015
0.010
0.005
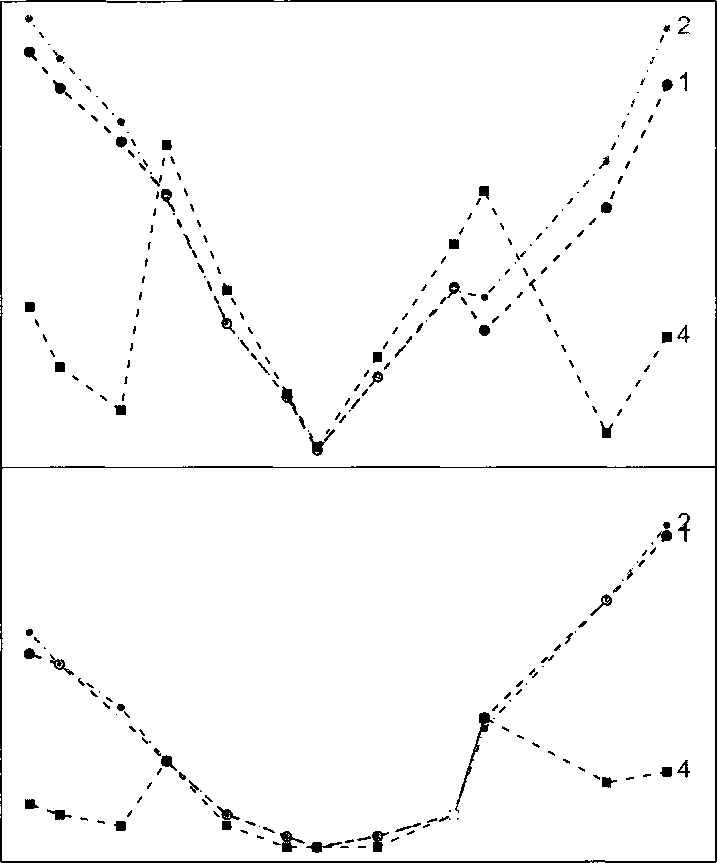

Simulation true success rates
Figure 4.1: Comparison of the estimated success rates under the four models under
SO. The horizontal axis shows the n = 12 success rates under the simulation truth
S0. The upper panel shows the absolute bias. The lower panel shows mean squared
error. Both are arranged by true pi. The five lines and labels correspond to the
models NEPPM with 7 = 1 [1], NEPPM with 7 = 1/2 [2], parametric Hierarchical
[3], HLRM [4] and separate [5] models.
More intriguing information
1. A dynamic approach to the tendency of industries to cluster2. Optimal Rent Extraction in Pre-Industrial England and France – Default Risk and Monitoring Costs
3. Determinants of Household Health Expenditure: Case of Urban Orissa
4. The Modified- Classroom ObservationScheduletoMeasureIntenticnaCommunication( M-COSMIC): EvaluationofReliabilityandValidity
5. Human Rights Violations by the Executive: Complicity of the Judiciary in Cameroon?
6. Økonomisk teorihistorie - Overflødig information eller brugbar ballast?
7. The name is absent
8. The name is absent
9. PROTECTING CONTRACT GROWERS OF BROILER CHICKEN INDUSTRY
10. Analyse des verbraucherorientierten Qualitätsurteils mittels assoziativer Verfahren am Beispiel von Schweinefleisch und Kartoffeln