98
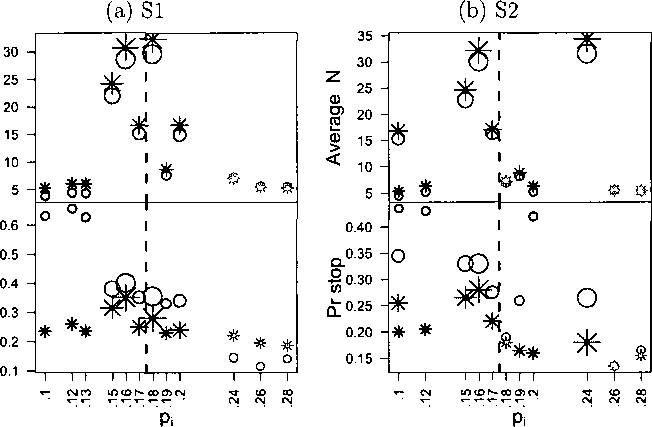
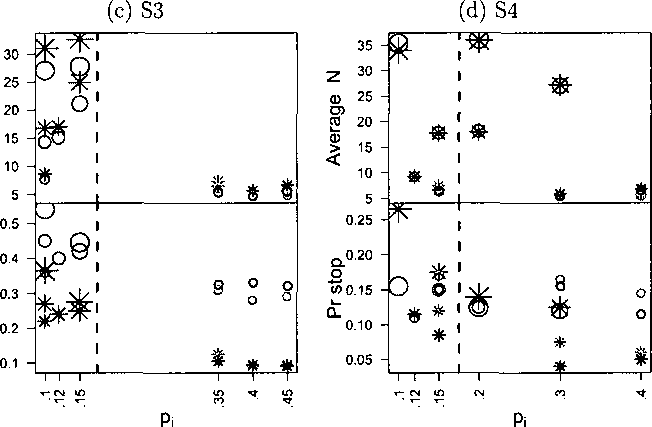
Figure 4.4: Sl through S4. Panels (a) through (d) show the average number of
patients (Ni) and early stopping probabilities (pi) under scenarios Sl through S4.
Both summaries are with respect to repeat experimentation. Summaries are arranged
by the simulation truth pi, shown on the horizontal axis. In each panel, the upper
part shows the average number of patients Ni that enter into the study for each
arm. The lower part shows the early stopping probability (pi). The stars (“*”) show
summaries under the NEPPM. The circles (“o”) show summaries for the HLRM. The
character size is proportional to Ni, the maximum sample size for each subtype.
More intriguing information
1. Imitation in location choice2. The name is absent
3. 03-01 "Read My Lips: More New Tax Cuts - The Distributional Impacts of Repealing Dividend Taxation"
4. Nurses' retention and hospital characteristics in New South Wales, CHERE Discussion Paper No 52
5. Evaluation of the Development Potential of Russian Cities
6. The name is absent
7. What should educational research do, and how should it do it? A response to “Will a clinical approach make educational research more relevant to practice” by Jacquelien Bulterman-Bos
8. The effect of globalisation on industrial districts in Italy: evidence from the footwear sector
9. Three Policies to Improve Productivity Growth in Canada
10. The name is absent