71
β future
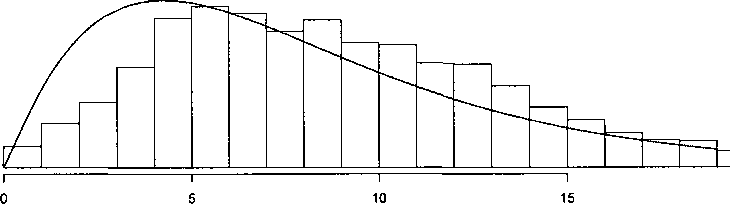
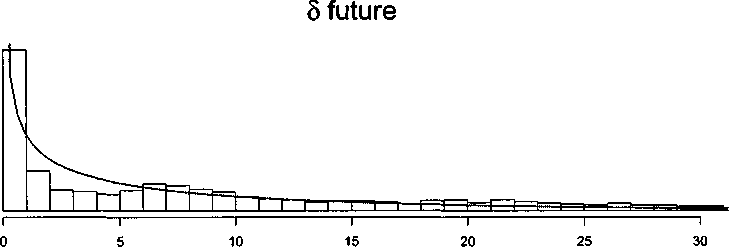
Figure 3.4: Histograms of a simulated sample of future observations of /3 and δ. They
estimate the true probability density function (continuous line) of the distribution that
generated the data
More intriguing information
1. The Impact of Hosting a Major Sport Event on the South African Economy2. Transfer from primary school to secondary school
3. The name is absent
4. The name is absent
5. Inflation and Inflation Uncertainty in the Euro Area
6. Top-Down Mass Analysis of Protein Tyrosine Nitration: Comparison of Electron Capture Dissociation with “Slow-Heating” Tandem Mass Spectrometry Methods
7. Place of Work and Place of Residence: Informal Hiring Networks and Labor Market Outcomes
8. Natural hazard mitigation in Southern California
9. How do investors' expectations drive asset prices?
10. Credit Markets and the Propagation of Monetary Policy Shocks